
Sidebar
endurox:v7.0.x:guides:ex_adminman
Table of Contents
- 1. How to configure Enduro/X
- 2. Setup System
- 3. Setup environment configuration
- 4. Setting up Enduro/X demonstration environment
- 5. Cluster configuration
- 6. Max message size and internal buffer sizes
- 7. Enduro/X Smart Cache
- 8. Enduro/X Monitoring with NetXMS
- Additional documentation
- Glossary
List of Tables
To configure Enduro/X you have to finish several steps.
- Have a separate system user for each Enduro/X instance.
- Setup System Environment (mount mq file system, configure mq params)
- Setup environment configuration
- Setup basic environment (demo)
- Startup the application
Enduro/X supports different back-end message transports. Following mechanisms are available:
- EPOLL (for FreeBSD it is Kqueue) over the Posix queues. This is fastest and most preferred transport mechanism when available. True on queue multiple servers mechanism is supported for different services across different XATMI server binaries (transport code "epoll" for GNU/Linux and "kqueue" for FreeBSD).
- System V message queues, this is generally second best transport available on Linux and Unix operating systems. One queue multiple servers mechanism is available via Request Address option (rqaddr) for XATMI server. The limitation is that each server running on same request address MUST provide all services provided by other servers in same Request Address. This mechanism uses at-least one additional thread per XATMI participant for handling message send/receive time-outs. In case if XATMI server, additional more thread is used for administrative message handling and dispatching to main server thread. Thus compiler must support the multi-threaded operations for user applications (transport code "SystemV").
- The third option if POLL over the Posix queues. This uses round-robin approach for message delivery to load balanced servers. One additional thread is used for server process to monitor queues (transport code "poll").
- The forth option is emulated message queue which uses shared memory and process shared Posix locks to emulate the mssage queue (transport code "emq").
Table 2.1. Enduro/X IPC transport sub-systems
| Operating System/IPC Transport | epoll | kqueue | systemv | poll | emq |
|---|---|---|---|---|---|
GNU/Linux | R | X | R | S | S |
FreeBSD | X | R | S | S | S |
IBM AIX | X | X | R | S | S |
Oracle Solaris | X | X | R | S | S |
MacOS | X | X | X | X | R |
Legend:
S - supported.
R - supported and release provided.
X - not supported.
Each of these IPC transports for particular operating system requires specific approach for configuring the limits and other attributes for runtime.
Note that transport version is built into Enduro/X distribution. Thus to change the IPC transport, different Enduro/X version must be installed (i.e. cannot be changed by parameters). As the ABI for user apps stays the same, the user application is not required to be rebuilt.
The release file for Enduro/X encodes different information. For example file names
- endurox-5.4.1-1.ubuntu18_04_GNU_epoll.x86_64_64.deb
- endurox-5.4.1-1.SUNOS5_10_GNU_SystemV.sparc_64
encodes following information:
Table 2.2. Enduro/X distribution file name naming conventions
| Product name | Version | Release | OS Name | C Compiler ID | OS Version | IPC Transport | CPU Arch | Target |
|---|---|---|---|---|---|---|---|---|
endurox | 5.4.1 | 1 | Ubuntu | 18.04 | GNU GCC | EPOLL | x86_64 | 64 bit mode |
endurox | 5.4.1 | 1 | SUNOS - Solaris | 5.10 (10) | GNU GCC | System V queues | SPARC | 64 bit mode |
In this chapter will be described typical GNU/Linux system configuration required for Enduro/X. Two sets of configurations are available for Linux OS. One is for Posix queues with epoll and another configuration is System V configuration.
Kernel parameter configuration is needed for Enduro/X runtime. But as we plan here to build the system and run unit-tests, then we need a configuration for runtime.
$ sudo -s
# cat << EOF >> /etc/security/limits.conf

# Do not limit message Q Count.
# Some Linux 3.x series kernels have a bug, that limits 1024
# queues for one system user.
# In 2.6.x and 4.x this is fixed, to have
# unlimited count of queues (memory limit).
# ealrier and later Linuxes have fixed this issue.
*               soft    msgqueue        -1
*               hard    msgqueue        -1

# Increase the number of open files
*               soft    nofile  1024
*               hard    nofile  65536

EOF
# exit
$
This step request mounting of Posix queues and change Posix queue limits
This step does not apply to following Operating Systems - for these continue with next chapter:
- Ubuntu 16.04 and above
- Debian 8.x and above
When running in e-poll mode Enduro/X needs access to virtual file system which provides Posix queue management. One way would be to mount it via "/etc/fstab", but for older system compatibility, we provide instructions that would work for all OSes. To do this automatically at system startup, Linuxes which supports /etc/rc.local, must add following lines before "exit 0".
#!/bin/bash

# Mount the /dev/mqueue
# Not for Debian 8.x: queue is already mounted, thus test:

if [ ! -d /dev/mqueue ]; then
        mkdir /dev/mqueue
        mount -t mqueue none /dev/mqueue
fi

exit 0
Note for Centos/RHEL/Oracle Linux 7+ you need to give execute permissions for rc.local:
# chmod +x /etc/rc.local
Load the configuration by doing:
# /etc/rc.local
Next step is to configure queue limits, this is done by changing Linux kernel parameters, in persistent way, so that new settings are applied at the OS boot.
$ sudo -s

# cat << EOF >> /etc/sysctl.conf

# Max Messages in Queue
fs.mqueue.msg_max=10000

# Max message size, to pass unit tests, use 1M+1K
fs.mqueue.msgsize_max=1049600

# Max number of queues for user
fs.mqueue.queues_max=10000

EOF

# Apply kernel parameters now
$ sudo sysctl -f /etc/sysctl.conf

# to check the values, use (print all) and use grep to find:
$ sudo sysctl -a | grep msgsize_max
To pass the Enduro/X unit tests, certain queue configuration is required. Use following kernel settings:
$ sudo -s

# cat << EOF >> /etc/sysctl.conf

# max queues system wide, 40K should be fine
kernel.msgmni=40000

# max size of message (bytes), ~1M should be fine
kernel.msgmax=1049600

# default max size of queue (bytes), ~10M should be fine
kernel.msgmnb=104960000

EOF

# persist the values
$ sudo sysctl -f /etc/sysctl.conf

# Check status...
$ sudo sysctl -a | grep msgmnb
For FreeBSD only officially supported version if Posix queues, thus this operating system requires some settings for these IPC resources to pass the unit testing and also settings are generally fine for average application.
Queue file system must be mounted when OS starts. Firstly we need a folder /mnt/mqueue where the queues are mount. And secondly we will add the automatic mount at system startup in /etc/fstab.
# mkdir /mnt/mqueue
# cat << EOF >> /etc/fstab
null    /mnt/mqueue     mqueuefs             rw      0       0
EOF
# mount /mnt/mqueue
You also need to change the queue parameters:
# cat << EOF >> /etc/sysctl.conf

# kernel tunables for Enduro/X:
kern.mqueue.curmq=1
kern.mqueue.maxmq=30000
kern.mqueue.maxmsgsize=64000
kern.mqueue.maxmsg=1000

EOF

# sysctl -f /etc/sysctl.conf
For LMDB testing more semaphores shall be allowed
# cat << EOF >> /boot/loader.conf

# kernel tunables for Enduro/X:
kern.ipc.semmns=2048
kern.ipc.semmni=500

EOF
After changing /boot/loader.conf, reboot of system is required.
Enduro/X testing framework uses /bin/bash in scripting, thus we must get it working. Also perl is assumed to to be /usr/bin/perl. Thus:
# ln -s /usr/local/bin/bash /bin/bash
# ln -s /usr/local/bin/perl /usr/bin/perl
reboot to apply new settings (limits & mqueue mount)
On the other hand AIX do not require any fine tuning for System V queues, because it is doing automatic adjustments to queue limitations. However to pass the Enduro/X standard unit tests, the security limits must be configured. Unit tests uses standard user "user1" for this purposes. Thus here stack, data mem size, file size and rss sizes are set to unlimited. For example if stack/data/rss is not set correctly, some multi-threaded components of Enduro/X might hang during the startup, for example tpbridge(8).
cat << EOF >> /etc/security/limits

user1:
        stack = 655360
        data = -1
        rss = -1
        fsize = -1
EOFTo pass the Enduro/X unit tests on Solaris, System V queue settings must be applied.
# cat << EOF >> /etc/system
set msgsys:msginfo_msgmni = 10000
set msgsys:msginfo_msgmnb = 10496000

EOF
So here msgmni is maximum number of queues that can be created and msgmnb is single queue maximum size which here is 10MB.
After changing the settings, reboot the server.
OSX does not use require any kernel parameter changes, as emulated message queue is used here. Only it required that sufficient disk space is available to /tmp directory, as the memory mapped queue files will be stored there.
As Enduro/X uses System V shared memory segments, the default sizes are not sufficient for the at least Enduro/X unit testing. Thus limits needs to be changed:
Starting from OS X 10.3.9 the config file is /etc/sysctl.conf, in oder versions use /boot/loader.conf:
$ sudo -s
# cat << EOF >> /etc/sysctl.conf
kern.sysv.shmmax=419430400
kern.sysv.shmmin=1
kern.sysv.shmmni=32
kern.sysv.shmseg=8
kern.sysv.shmall=102400
kern.maxfiles=524288
kern.maxfilesperproc=262144

EOF
After this reboot is required.
Enduro/X depends lot of Environment variables. See manpage of ex_env ([EX_ENV]) to see all parameters that must be setup. There is also sample configuration provided. Normally it is expected that separate shell script file is setup containing all parameters. Then to load the environment, login with Enduro/X user in, and run following command in your app dir, for example:
$ cd /endurox/app/conf
$ . setapp
This section describes how to create a basic Enduro/X environment. Document will also explain the resources used by Enduro/X from the system setup and administrative perspective. Section will also explain the contents for each of the generated file, so that runtime can be manually reconstructed, which is usable for AIX operating system, as there "xadmin provision" command is not available.
To create generic runtime with Enduro/X "stock" servers processes, use following command:
$ xadmin provision  -d
To control debug output, set debugconfig file path in $NDRX_DEBUG_CONF
N:NDRX:4:00000000:    0:7fc81a75c900:000:20181110:113655631:plugins_load:inbase.c:0180:No plugins defined by NDRX_PLUGINS env variable
N:NDRX:5:00000000:    0:7fc81a75c900:000:20181110:113655631:cconfig_load:config.c:0429:CC tag set to: []
N:NDRX:5:00000000:    0:7fc81a75c900:000:20181110:113655631:x_inicfg_new:inicfg.c:0114:_ndrx_inicfg_new: load_global_env: 1
N:NDRX:5:00000000:    0:7fc81a75c900:000:20181110:113655631:ig_load_pass:config.c:0396:_ndrx_cconfig_load_pass: ret: 0 is_internal: 1 G_tried_to_load: 1
N:NDRX:5:d5d3db3a: 8685:7fc81a75c900:000:20181110:113655632:x_inicfg_new:inicfg.c:0114:_ndrx_inicfg_new: load_global_env: 0
Enduro/X 5.4.1, build Nov  7 2018 08:48:27, using SystemV for LINUX (64 bits)

Enduro/X Middleware Platform for Distributed Transaction Processing
Copyright (C) 2009-2016 ATR Baltic Ltd.
Copyright (C) 2017,2018 Mavimax Ltd. All Rights Reserved.

This software is released under one of the following licenses:
AGPLv3 or Mavimax license for commercial use.

Logging to ./ULOG.20181110

    ______          __                    ___  __
   / ____/___  ____/ /_  ___________    _/_/ |/ /
  / __/ / __ \/ __  / / / / ___/ __ \ _/_/ |   /
 / /___/ / / / /_/ / /_/ / /  / /_/ //_/  /   |
/_____/_/ /_/\__,_/\__,_/_/   \____/_/   /_/|_|

                     Provision

Compiled system type....: LINUX


*** Review & edit configuration ***

 0: Edit qpath        :Queue device path [/dev/mqueue]:
 1: Edit nodeid       :Cluster node id [2]:
 2: Edit qprefix      :System code (prefix/setfile name, etc) [test1]:
 3: Edit timeout      :System wide tpcall() timeout, seconds [90]:
 4: Edit appHome      :Application home [/tmp/demo]:
 6: Edit binDir       :Executables/binaries sub-folder of Apphome [bin]:
 8: Edit confDir      :Configuration sub-folder of Apphome [conf]:
 9: Edit logDir       :Log sub-folder of Apphome [log]:
10: Edit ubfDir       :Unified Buffer Format (UBF) field defs sub-folder of Apphome [ubftab]:
11: Edit tempDir      :Temp sub-dir (used for pid file) [tmp]:
12: Edit installQ     :Configure persistent queue [y]:
13: Edit tmDir        :Transaction Manager Logs sub-folder of Apphome [tmlogs]:
14: Edit qdata        :Queue data sub-folder of Apphone [qdata]:
15: Edit qSpace       :Persistent queue space namme [SAMPLESPACE]:
16: Edit qName        :Sample persistent queue name [TESTQ1]:
17: Edit qSvc         :Target service for automatic queue for sample Q [TESTSVC1]:
18: Edit eventSv      :Install event server [y]:
19: Edit cpmSv        :Configure Client Process Monitor Server [y]:
20: Edit configSv     :Install Configuration server [y]:
21: Edit bridge       :Install bridge connection [y]:
22: Edit bridgeRole   :Bridge -> Role: Active(a) or passive(p)? [a]:
24: Edit ipc          :Bridge -> IP: Connect to [172.0.0.1]:
25: Edit port         :Bridge -> IP: Port number [21003]:
26: Edit otherNodeId  :Other cluster node id [2]:
27: Edit ipckey       :IPC Key used for System V semaphores [44000]:
28: Edit ldbal        :Load balance over cluster [0]:
29: Edit ndrxlev      :Logging: ATMI sub-system log level 5 - highest (debug), 0 - minimum (off) [5]:
30: Edit ubflev       :Logging: UBF sub-system log level 5 - highest (debug), 0 - minimum (off) [1]:
31: Edit tplev        :Logging: /user sub-system log level 5 - highest (debug), 0 - minimum (off) [5]:
32: Edit usv1         :Configure User server #1 [n]:
50: Edit ucl1         :Configure User client #1 [n]:
55: Edit addubf       :Additional UBFTAB files (comma seperated), can be empty []:
56: Edit msgsizemax   :Max IPC message size [56000]:
57: Edit msgmax       :Max IPC messages in queue [100]:
ndrxconfig: [/tmp/demo/conf/ndrxconfig.xml]
appini: [/tmp/demo/conf/app.ini]
setfile: [/tmp/demo/conf/settest1]


To start your system, run following commands:
$ cd /tmp/demo/conf
$ source settest1
$ xadmin start -y


Provision succeed!
During the provision following directory structure was created at project root which is "/tmp/demo", where following data is intended to be stored:
Table 4.1. Enduro/X distribution file name naming conventions
| Directory | File stored |
|---|---|
ubftab | UBF field tables |
tmlogs/rm1 | transaction manager logs, sub-folder for resource manager 1 |
conf | configuration files |
bin | program binaries (executables) |
qdata | persistent queue data |
tmp | temporary files like pid file, etc. |
log | Enduro/X and user log files |
If demo needs to be started on AIX os, then these folders needs to be created by hand.
Most interesting thing at the given step is configuration files. The provision generates following list of files in "conf" folder:
Table 4.2. Enduro/X typical application configuration files
| Directory | File stored |
|---|---|
app.ini | Application configuration |
ndrxconfig.xml | Application server process configuration |
settest1 | Bash script for setting the Enduro/X environment |
Next chapters describe contents for each of the configuration files
This file contains global settings (which alternatively can be set as environment variables, see ex_env(5)) in section [@global]. app.ini also contains debug configuration in section [@debug] (which alternatively can be configured in separated file, see ndrxdebug.conf(5)). The ini file is also used by other Enduro/X services like persistent queues, defined in [@queue]. The ini files allows sections to inherit settings from parents sections. The sub-sections can be configuration at process level with NDRX_CCTAG env variable, or this can be done in ndrxconfig.xml at <cctag /> XML tag for XATMI servers and cctag attribute for CPMSRV clients.
The demo app.ini section looks like:
[@global]
NDRX_CLUSTERISED=1
NDRX_CMDWAIT=1
NDRX_CONFIG=${NDRX_APPHOME}/conf/ndrxconfig.xml
NDRX_DMNLOG=${NDRX_APPHOME}/log/ndrxd.log
NDRX_DPID=${NDRX_APPHOME}/tmp/ndrxd.pid
NDRX_DQMAX=100
NDRX_IPCKEY=44000
NDRX_LDBAL=0
NDRX_LEV=5
NDRX_LOG=${NDRX_APPHOME}/log/xadmin.log
NDRX_MSGMAX=100
NDRX_MSGSIZEMAX=56000
NDRX_NODEID=2
NDRX_QPATH=/dev/mqueue
NDRX_QPREFIX=/test1
NDRX_RNDK=0myWI5nu
NDRX_SRVMAX=10000
NDRX_SVCMAX=20000
NDRX_TOUT=90
NDRX_UBFMAXFLDS=16000
NDRX_ULOG=${NDRX_APPHOME}/log
FIELDTBLS=Exfields
FLDTBLDIR=${NDRX_APPHOME}/ubftab

; Environment for Transactional Queue
[@global/RM1TMQ]
NDRX_XA_RES_ID=1
NDRX_XA_OPEN_STR=${NDRX_APPHOME}/qdata
NDRX_XA_CLOSE_STR=${NDRX_APPHOME}/qdata
NDRX_XA_DRIVERLIB=libndrxxaqdisks.so
; dylib needed for osx
NDRX_XA_RMLIB=libndrxxaqdisk.so
NDRX_XA_LAZY_INIT=0

[@debug]
; * - goes for all binaries not listed bellow
*= ndrx=5 ubf=1 tp=5 file=
xadmin= ndrx=5 ubf=1 tp=5 file=${NDRX_APPHOME}/log/xadmin.log
ndrxd= ndrx=5 ubf=1 tp=5 file=${NDRX_APPHOME}/log/ndrxd.log

; Queue definitions goes here, see man q.conf(5) for syntax
[@queue]
; Default manual queue (reserved name '@'), unknown queues are created based on this template:
@=svcnm=-,autoq=n,waitinit=0,waitretry=0,waitretryinc=0,waitretrymax=0,memonly=n,mode=fifo

[@queue/RM1TMQ]
; Sample queue (this one is automatic, sends messages to target service)
TESTQ1=svcnm=TESTSVC1,autoq=y,tries=3,waitinit=1,waitretry=1,waitretryinc=2,waitretrymax=5,memonly=n,mode=fifo
The above also describes the configuration for Resource Manager 1 - which is used by persistent message queue. The Resource manager settings applies at global level and one process may only work with one RM, thus processes operating with particular Resource Manager, shall use CCTAG "RM1TMQ".
The demo system does not include any user processes, but almost all Enduro/X distributed special services are configuration. The configuration of system processes looks almost the same as for user processes, thus this gives some insight on how to configure the system.
<?xml version="1.0" ?>
<endurox>
        <!--
                *** For more info see ndrxconfig.xml(5) man page. ***
        -->
        <appconfig>
                <!--
                        ALL BELLOW ONES USES <sanity> periodical timer
                        Sanity check time, sec
                -->
                <sanity>1</sanity>

                <!--
                        Seconds in which we should send service refresh to other node.
                -->
                <brrefresh>5</brrefresh>

                <!--
                        Do process reset after 1 sec
                -->
                <restart_min>1</restart_min>

                <!--
                        If restart fails, then boot after +5 sec of previous wait time
                -->
                <restart_step>1</restart_step>

                <!--
                        If still not started, then max boot time is a 30 sec.
                -->
                <restart_max>5</restart_max>

                <!--
                        <sanity> timer, usage end
                -->

                <!--
                Time (seconds) after attach when program will start do sanity & respawn checks,
                starts counting after configuration load
                -->
                <restart_to_check>20</restart_to_check>


                <!--
                        Setting for pq command, should ndrxd collect service
                        queue stats automatically If set to Y or y,
                        then queue stats are on. Default is off.
                -->
                <gather_pq_stats>Y</gather_pq_stats>

        </appconfig>
        <defaults>

                <min>1</min>
                <max>2</max>
                <!--
                        Kill the process which have not started in <start_max> time
                -->
                <autokill>1</autokill>

                <!--
                        The maximum time while process can hang in 'starting' state i.e.
                        have not completed initialization, sec X <= 0 = disabled
                -->
                <start_max>10</start_max>

                <!--
                        Ping server in every X seconds (step is <sanity>).
                -->
                <pingtime>100</pingtime>

                <!--
                        Max time in seconds in which server must respond.
                        The granularity is sanity time.
                        X <= 0 = disabled
                -->
                <ping_max>800</ping_max>

                <!--
                        Max time to wait until process should exit on shutdown
                        X <= 0 = disabled
                -->
                <end_max>10</end_max>

                <!--
                        Interval, in seconds, by which signal sequence -2, -15, -9, -9.... will be sent
                        to process until it have been terminated.
                -->
                <killtime>1</killtime>

        </defaults>
        <servers>
                <server name="cconfsrv">
                        <min>2</min>
                        <max>2</max>
                        <srvid>1</srvid>
                        <sysopt>-e ${NDRX_APPHOME}/log/cconfsrv.log -r</sysopt>
                </server>
                <server name="tpevsrv">
                        <min>2</min>
                        <max>2</max>
                        <srvid>20</srvid>
                        <sysopt>-e ${NDRX_APPHOME}/log/tpevsrv.log -r</sysopt>
                </server>
                <server name="tmsrv">
                        <min>3</min>
                        <max>3</max>
                        <srvid>40</srvid>
                        <cctag>RM1TMQ</cctag>
                        <sysopt>-e ${NDRX_APPHOME}/log/tmsrv-rm1.log -r -- -t1 -l${NDRX_APPHOME}/tmlogs/rm1</sysopt>
                </server>
                <server name="tmqueue">
                        <min>1</min>
                        <max>1</max>
                        <srvid>60</srvid>
                        <cctag>RM1TMQ</cctag>
                        <sysopt>-e ${NDRX_APPHOME}/log/tmqueue-rm1.log -r -- -m SAMPLESPACE -s1</sysopt>
                </server>
                <server name="tpbridge">
                        <min>1</min>
                        <max>1</max>
                        <srvid>150</srvid>
                        <sysopt>-e ${NDRX_APPHOME}/log/tpbridge_2.log -r</sysopt>
                        <appopt>-f -n2 -r -i 172.0.0.1 -p 21003 -tA -z30</appopt>
                </server>
                <server name="cpmsrv">
                        <min>1</min>
                        <max>1</max>
                        <srvid>9999</srvid>
                        <sysopt>-e ${NDRX_APPHOME}/log/cpmsrv.log -r -- -k3 -i1</sysopt>
                </server>
        </servers>
        <!--
                Client section
        -->
        <clients>
                <!--
                        Test parameter passing to process
                        - To list clients:$ xadmin pc
                        - To stop client: $ xadmin sc -t TAG1 -s SUBSECTION1
                        - To boot client: $ xadmin bc -t TAG1 -s SUBSECTION1
                -->
                <client cmdline="your_test_binary.sh -t ${NDRX_CLTTAG} -s ${NDRX_CLTSUBSECT}">
                        <exec tag="TAG1" subsect="SUBSECTION1" autostart="Y" log="${NDRX_APPHOME}/log/testbin-1.log"/>
                        <exec tag="TAG2" subsect="SUBSECTION2" autostart="Y" log="${NDRX_APPHOME}/log/testbin-3.log"/>
                </client>
                <client cmdline="your_test_binary2.sh -t ${NDRX_CLTTAG}">
                        <exec tag="TAG3" autostart="Y" log="${NDRX_APPHOME}/log/testbin2-1.log"/>
                </client>
        </clients>
</endurox>
The above configuration includes the maximum settings which are by default on from the provision script. This includes configuration servers (cconfsrv(8)) - which allows to download the configuration from ini files by standard tpcall(3) command. Then it also includes event server, persistent queue and transaction manager for persistent queue. Bridge connection, configured as active (client) side is added and client process monitor (cpmsrv(8)) is started with server id 9999. Thus once cpmsrv is booted, it will start the processes from "<clients/>" tag.
To setup cluster see you have to setup bridge ATMI processes on each of the machines. See [TPBRIDGE] documentation to have understanding of clustering. Sample setup of cluster node which actively connects to Node 2 and waits call from Node 12 could look like:
<?xml version="1.0" ?>
<endurox>
        <appconfig>
                <sanity>10</sanity>
                <brrefresh>6</brrefresh>
                <restart_min>1</restart_min>
                <restart_step>1</restart_step>
                <restart_max>5</restart_max>
                <restart_to_check>20</restart_to_check>
        </appconfig>
        <defaults>
                <min>1</min>
                <max>2</max>
                <autokill>1</autokill>
                <respawn>1<respawn>
                <start_max>2</start_max>
                <pingtime>1</pingtime>
                <ping_max>4</ping_max>
                <end_max>3</end_max>
                <killtime>1</killtime>
        </defaults>
        <servers>
                <!-- Connect to cluster node 2, we will wait for call -->
                <server name="tpbridge">
                        <max>1</max>
                        <srvid>101</srvid>
                        <sysopt>-e /tmp/BRIDGE002 -r</sysopt>
                        <appopt>-n2 -r -i 0.0.0.0 -p 4433 -tP -z30</appopt>
                </server>
                <!-- Connect to cluster node 12, we try to connect activetly to it -->
                <server name="tpbridge">
                        <max>1</max>
                        <srvid>102</srvid>
                        <sysopt>-e /tmp/BRIDGE012 -r</sysopt>
                        <appopt>-n12 -r -i 195.122.24.13 -p 14433 -tA -z30</appopt>
                </server>
        </servers>
</endurox>The startup is straight forward. The environment variables needs to be loaded either by source command or by dot (.) notation.
$ cd /tmp/demo/conf
$ source settest1
$ xadmin start -y
Enduro/X 5.4.1, build Nov  7 2018 08:48:27, using SystemV for LINUX (64 bits)

Enduro/X Middleware Platform for Distributed Transaction Processing
Copyright (C) 2009-2016 ATR Baltic Ltd.
Copyright (C) 2017,2018 Mavimax Ltd. All Rights Reserved.

This software is released under one of the following licenses:
AGPLv3 or Mavimax license for commercial use.

* Shared resources opened...
* Enduro/X back-end (ndrxd) is not running
* ndrxd PID (from PID file): 18037
* ndrxd idle instance started.
exec cconfsrv -k 0myWI5nu -i 1 -e /tmp/demo/log/cconfsrv.log -r --  :
        process id=18041 ... Started.
exec cconfsrv -k 0myWI5nu -i 2 -e /tmp/demo/log/cconfsrv.log -r --  :
        process id=18045 ... Started.
exec tpevsrv -k 0myWI5nu -i 20 -e /tmp/demo/log/tpevsrv.log -r --  :
        process id=18049 ... Started.
exec tpevsrv -k 0myWI5nu -i 21 -e /tmp/demo/log/tpevsrv.log -r --  :
        process id=18053 ... Started.
exec tmsrv -k 0myWI5nu -i 40 -e /tmp/demo/log/tmsrv-rm1.log -r -- -t1 -l/tmp/demo/tmlogs/rm1 --  :
        process id=18057 ... Started.
exec tmsrv -k 0myWI5nu -i 41 -e /tmp/demo/log/tmsrv-rm1.log -r -- -t1 -l/tmp/demo/tmlogs/rm1 --  :
        process id=18072 ... Started.
exec tmsrv -k 0myWI5nu -i 42 -e /tmp/demo/log/tmsrv-rm1.log -r -- -t1 -l/tmp/demo/tmlogs/rm1 --  :
        process id=18087 ... Started.
exec tmqueue -k 0myWI5nu -i 60 -e /tmp/demo/log/tmqueue-rm1.log -r -- -m SAMPLESPACE -s1 --  :
        process id=18102 ... Started.
exec tpbridge -k 0myWI5nu -i 150 -e /tmp/demo/log/tpbridge_2.log -r -- -f -n2 -r -i 172.0.0.1 -p 21003 -tA -z30 :
        process id=18137 ... Started.
exec cpmsrv -k 0myWI5nu -i 9999 -e /tmp/demo/log/cpmsrv.log -r -- -k3 -i1 --  :
        process id=18146 ... Started.
Startup finished. 10 processes started.
The application instance is started!
Starting from Enduro/X version 5.1+, the max message size what can be transported over the XATMI sub-system is limited to the operating system’s queue settings. For example on Linux kernel 3.13 the message size limit (/proc/sys/fs/mqueue/msgsize_max) is around 10 MB. The message size is configured with NDRX_MSGMAX environment variable, see ex_env(5) man page.
Also what should be noted, as Enduro/X mostly uses stack allocation instead of heap allocation (for safer and faster code), then there are requirements against the stack size. The stack size (ulimit -s) must be at least size of message multiplied with 30. So for example if message size is set to 1 MegaByte, then stack size shall be set to 30 Mega bytes (ulimit -s 30720 KB). If the stack is not sufficient the following error will be print when attempting to run any Enduro/X based software:
Logging to ./ULOG.20171112
Failed to open [./ULOG.20171112]
 9138:20171112:19144166:xadmin      :LIMITS ERROR ! Please set stack (ulimit -s) size to: 1966080 bytes or 1920 kb (calculated by: NDRX_MSGSIZEMAX(65536)*NDRX_STACK_MSG_FACTOR(30))

LIMITS ERROR ! Please set stack (ulimit -s) size to: 1966080 bytes or 1920 kb (calculated by: NDRX_MSGSIZEMAX(65536)*NDRX_STACK_MSG_FACTOR(30))
Process is terminating with error...
In this case stack size needs to be increased, that could be done by in multiple ways:
- Change by $ ulimit -s 1920 To ensure that this is set each time the Enduro/X is started, it needs to be added to the "env" script of the application which prepares application environment before app boot. Also system settings must be checked in /etc/security/limits.conf either the limit is enough - "stack" parameter.
- Set the user/system limit directly in /etc/security/limits.conf. For other operating systems, please consult with corresponding manual for changing the message size and stack size.
Also regarding the buffer sizes, when NDRX_MSGMAX is set bellow 64K, the buffer size is fixed to 64K, this means that operations like network packet size when using tpbridge, is set to 64K.
As the message size is in the same time a internal buffer size, this means that not all space can be used by sending some data (for example CARRAY or UBF buffer). Some overhead is added by Enduro/X, message headers, for bridge protocol format extra data is added for TLV structure. Thus to be safe, for example if expected data size is 64K, then message size should be set to something like 80KB.
For threads which are spawned by Enduro/X for bridge, transaction manager and other processes, the Pthreads stack size is automatically adjusted. By default new thread does not use parent’s thread stack size, but instead some default value is used. Which usually is quite small. Thus to get rid with this problem Enduro/X detects current process stack limit and tries to set this in thread attributes. To get current stack size, the getrlimit (RLIMIT_STACK, …) system call is used. How ever with IBM AIX 7.1 SP 2 TL 5, it is been seen that pthread_attr_setstacksize() fails for read stack size, with error EINVAL. Thus this give some uncertainty what stack size to use. Thus to fix the problem, the code tries in loop the use the size attribute, each time with failure new stack size is two times lower than previous. This is done until the correct value is found. If value is not found (i.e. target size is 0 after divisions), the user message is logged:
Error ! failed to set stack value!
Process continues after this, but it can be expected that random errors or core dumps may appear.
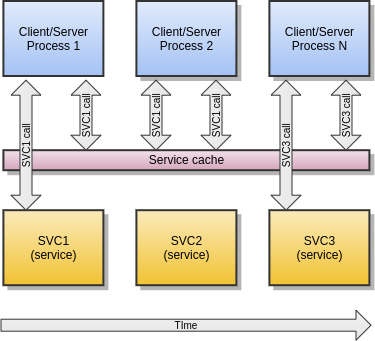
Enduro/X support SOA level cache. This means that administrator can configure system configuration, so that certain services are cached. Thus if some client process calls some service X, and it gets valid results back, then data key is built (specified in config) and for this key data is saved to Lightning Memory-Mapped Database (LMDB). Next time service is called, the cache is checked, again, key is built, and lookup to LMDB is made. If results are found in db, then actual service is X is not called, but instead saved buffer from cache is returned back to caller. Cache works for tpcall() function.
Cache supports different features:
- Limited or unlimited caches are available. The unlimited cache is bound to physical dimensions of db file (also specified in configuration). In case of limited cache, number of logical items stored in cache can be specified. This is set by limit parameter for database configuration. In case if limit is specified the strategy how to remove over-reached records can be specified in database flags. The strategies supported are following: LRU - keep records recently used, FIFO - delete records by chronological order (older records added to cache are being deleted), HITS - records mostly accessed stays in cache.
- Multiple physical storage definitions, so that XATMI services can be allocated in different or same physical storage. This can help to solve challenges between storage space limitations and performance limitations (when multiple writes are done in same physical storage).
- Cache is Enduro/X cluster aware. Records can be distributed and deleted across the cluster nodes. Time based sync is supported when in the same time both nodes adds records to non existing cache cell. On both cluster nodes will survive record which is fresher. The older duplicate is zapped by tpcall() or by tpcached.
- Records can be grouped for example statement pages can be all linked to single user. If transaction happens for user, then whole group can be invalidated. Thus build cache again. Grouping can be also used for Denial Of Service (DoS) protection. Enduro/X can be configured to limit the max number of new records in group, after which any new non existing data element lookup in group will make request buffer to reject with configured tperrno, user return code and buffer.
- Records in cache can be cross-invalidated. Meaning that "hooks" can be put on certain service calls in order to invalidate - zap contents of some other cache.
- Cache supports refresh conditions. So that in case if specific condition over the data is true, the cached data not returned, but service invocation is performed and re-cached (old data overwritten).
The LMDB is build in such way that if write transaction on the database is open, then other writes will not be able to process it in meantime. While read only transactions are processed, while some other process holds write transaction. Also if process which is holding the lock is crashed (e.g. segfaul, kill, etc..), then lock is automatically made free. Thus for example is using hits or lru limitation caches, then this automatically means that during the tpcall() caches needs to be updated, thus lock is needed, and this means that all callers will have to sync in that place - thus makes point of bottleneck.
NetXMS monitoring tool has the agent plugin for Enduro/X. This section will describe the basic elements how to monitor Enduro/X with help of this tool
Enduro/X exposes following list of the tables which can monitor:
- Endurox.Clients - information about client processes.
- Endurox.Machines - information about cluster machines.
- Endurox.Queues - information about local queues.
- Endurox.ServerInstances - information about XATMI server processes.
- Endurox.ServiceGroups - dynamic information about XATMI services.
- Endurox.Services - static information about XATMI services.
To start the Enduro/X monitoring with the NetXMS, firstly the agent must be compiled with Enduro/X support. Thus the system has to have compiler installed and access to Internet must be (for fetching the sources from the github).
To build the agent, system must have C/C++ compiler installed and "git" tool too. Basically if Enduro/X build dependencies are met on the host, then Netxms agent will build too. For more details consult with the project specific documentation.
But in general, to build the agent for Enduro/X, do the following steps:
$ git clone https://github.com/netxms/netxms
$ cd netxms
$ ./reconf
$ ./configure --with-agent --prefix=/path/to/install --with-tuxedo=/usr --disable-mqtt
$ make
$ sudo make install
If doing basic setup, then usually you need to setup the configuration file for agent to allow the incoming servers connections, for example:
# cat << EOF > /etc/nxagentd.conf

LogFile=/var/log/nxagentd

# IP white list, can contain multiple records separated by comma.
# CIDR notation supported for subnets.
MasterServers=127.0.0.0/8,172.17.0.1,192.168.43.98
ServerConnection=192.168.43.98
SubAgent=tuxedo.nsm

EOF
Once configuration is done, the nxagentd shall be started from Enduro/X environment, so that agent will be able to call tpadmsv(8) services. Usually agent is started from cpmsrv(8).
To start the agent manually, following commands may be used:
$ cd /path/to/install/bin

-- have some debug in current session:
$ ./nxagentd -D5

-- or to start as deamon:
$ ./nxagentd -D5
In case of CPMSRV, following can be used as configuration:
...
        <!-- Client section -->
        <clients>
...
                <client cmdline="/path/to/install/bin/nxagentd -D5 -c/etc/nxagentd.conf" log="/tmp/nxagentd.log">
                        <exec tag="NXAGENT" autostart="Y" />
                </client>
...
</clients>To check the list parameters that can be monitored, use following command:
$ nxget -l <agent ip addr>  Agent.SupportedParameters


...
Endurox.Client.ActiveConversations(*)
Endurox.Client.ActiveRequests(*)
Endurox.Client.Machine(*)
Endurox.Client.Name(*)
Endurox.Client.State(*)
Endurox.Domain.ID
Endurox.Domain.Queues
Endurox.Domain.Servers
Endurox.Domain.Services
Endurox.Domain.State
Endurox.Machine.Accessers(*)
Endurox.Machine.Clients(*)
Endurox.Machine.Conversations(*)
Endurox.Machine.State(*)
Endurox.Queue.Machine(*)
Endurox.Queue.RequestsCurrent(*)
Endurox.Queue.State(*)
Endurox.ServerInstance.CommandLine(*)
Endurox.ServerInstance.Generation(*)
Endurox.ServerInstance.Machine(*)
Endurox.ServerInstance.Name(*)
Endurox.ServerInstance.PID(*)
Endurox.ServerInstance.State(*)
Endurox.Service.State(*)
Endurox.ServiceGroup.CompletedRequests(*)
Endurox.ServiceGroup.FailedRequests(*)
Endurox.ServiceGroup.LastExecutionTime(*)
Endurox.ServiceGroup.MaxExecutionTime(*)
Endurox.ServiceGroup.MinExecutionTime(*)
Endurox.ServiceGroup.State(*)
Endurox.ServiceGroup.SuccessfulRequests(*)
To return the values from particular table, use following command:
$ nxget -T <agent ip> <table name e.g. Endurox.Clients>
In NetXMS it is possible import and monitor list of the resources. That can be done in the following way:
Firstly in Configure Data Collection Items (DCI) for new item. For example:
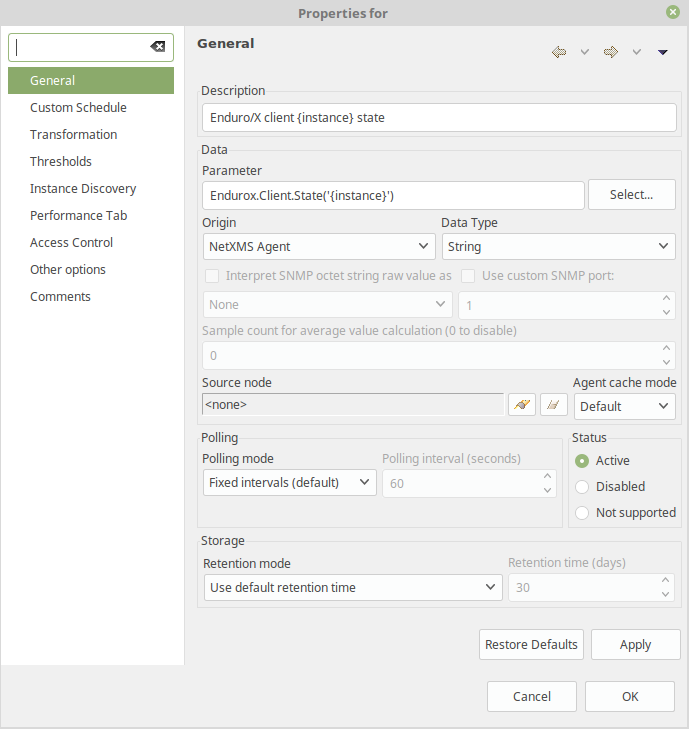
NOTE: As Enduro/X uses comma in identifiers, then in templates quotes must be
- Endurox.Queue
- Endurox.Clients
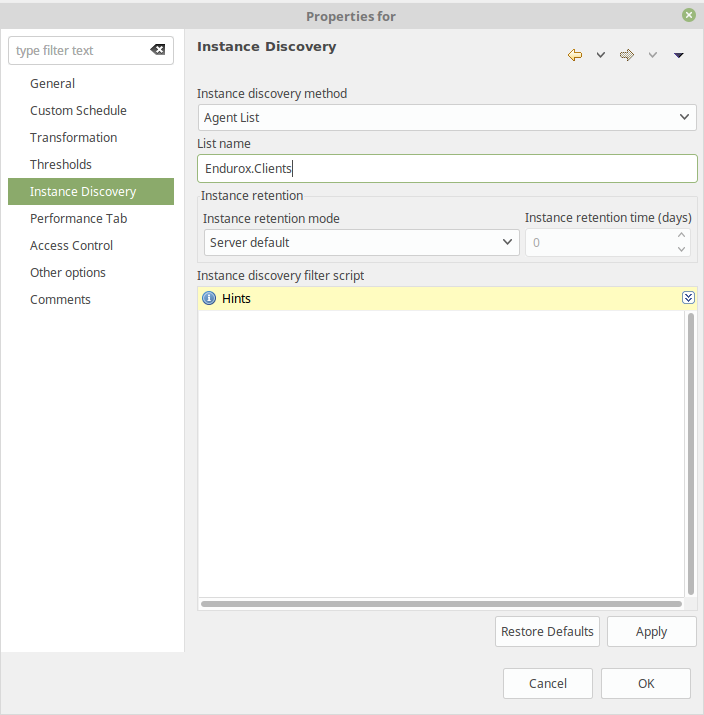
Next configure agent list from which to discover the items:
Once this is configured, instances shall be discovered. On monitored node in NetXMS Console, press left mouse button > Poll > Instance discovery
After running the instance discovery, following output may be received:
[02.09.2019 20:57:57] **** Poll request sent to server ****
[02.09.2019 20:57:57] Poll request accepted
[02.09.2019 20:57:57] Starting instance discovery poll for node mypc
[02.09.2019 20:57:57] Running DCI instance discovery
[02.09.2019 20:57:57] Updating instances for FileSystem.UsedPerc({instance}) [548]
[02.09.2019 20:57:57] Updating instances for FileSystem.FreePerc({instance}) [552]
[02.09.2019 20:57:57] Updating instances for Endurox.Client.State('{instance}') [627]
[02.09.2019 20:57:57] Creating new DCO for instance "/n00b,clt,reply,tmsrv,29321,2"
[02.09.2019 20:57:57] Creating new DCO for instance "/n00b,clt,reply,tmsrv,29304,2"
[02.09.2019 20:57:57] Creating new DCO for instance "1/NXAGENT/-/1"
[02.09.2019 20:57:57] Creating new DCO for instance "1/BINARY1/1"
[02.09.2019 20:57:57] Creating new DCO for instance "1/BINARY2/2"
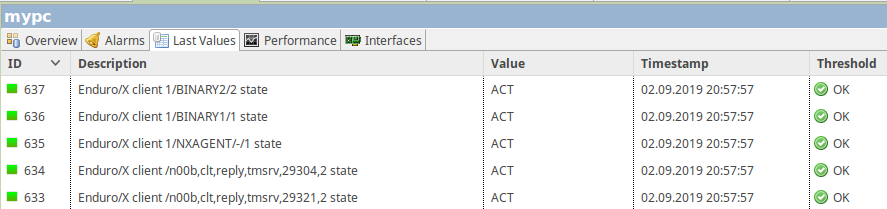
[02.09.2019 20:57:57] **** Poll completed successfully ****In the results in latest values new instances can be seen. In particular case status of clients are monitored:
This chapter will give some recipes how to efficiently configure the NetXMS monitoring system, to show following items on the dashboard:
- Show the single client process status (dead or running).
- Show the status for the group of processes or services (get the number of running instances) and show the last response times in the group of services.
- Show the total number of processed messages for some services and calculate the TPS. Also calculate the total failed messages.
The solution is based on NetXMS 3.1 version (2019), where status indicator is only available for Nodes and business services. This tutorial will use business services for status indicators. Data for monitoring can be gathered in two ways, one is by using DCI (GetDCIValues() (with last 60 seconds visibility to not to see removed DCIs) and other is by direct parameter readings (AgentReadTable() and AgentReadParameter()).
This tutorial will use AgentRead functions.
For XATMI status monitoring, script will be created which will check the presence for particular parameter and check that value matches ACT constant. If it matches, then script returns value 1, if it does not matches or parameter is not present, then script returns value 0.
Further this script can be used for building business service or for building new DCI, to get numeric value for client process status. This assumes that $node variable is available (i.e. script will be executed for some node/server monitored).
//Convert Enduro/X parameter state to number
//@param parameter is parameter name like "EnduroX.Client.State('2/TXUPLD/RUN7/1')"
// which is being monitored
//@return 0 - parameter not found or not ACT, 1 - Parameter found and is ACT
sub NdrxState2Num(parameter)
{
   v = AgentReadParameter($node, parameter);

   if (null==v)
        {
                return 0;
        }

   if (v=="ACT")
        {
                return 1;
        }

    return 0;
}


//If called from DCI...
//return NdrxState2Num($1);
To register script, it NetXMS Management Console, go to Configuration > Script Library and in the window press left mouse button "New…" to create a new script. The name may be the same NdrxState2Num. Copy the contents there in the window and save.
To call the NdrxState2Num() from DCI, create a wrapper script like this and save with name NdrxState2NumDci under the Script Library.
use NdrxState2Num;

//Wrapper for DCI
return NdrxState2Num($1);
To have status monitor indicators, next step is to create a business service. For example we want to monitor following 7 processes (IDs for clients, get by $ nxget -T 127.0.0.1 Endurox.Clients or $ xadmin mibget -c T_CLIENT):
- 2/TXUPLD/RUN1/1
- 2/TXUPLD/RUN2/1
- 2/TXUPLD/RUN3/1
- 2/TXUPLD/RUN4/1
To do this, in left menu under the "Business Services", new "Business Service" needs to be created under which "Node link" must be added only then "Service check…" shall be added. In other combination it wont work, and you will see question marks in the icon tree of NetXMS console.
To use NdrxState2Num() script for process checking in business service, following script can be used:
//Use script library
use NdrxState2Num;

if (0==NdrxState2Num("EnduroX.Client.State('2/TXUPLD/RUN1/1')"))
{
        return FAIL;
}

return OK;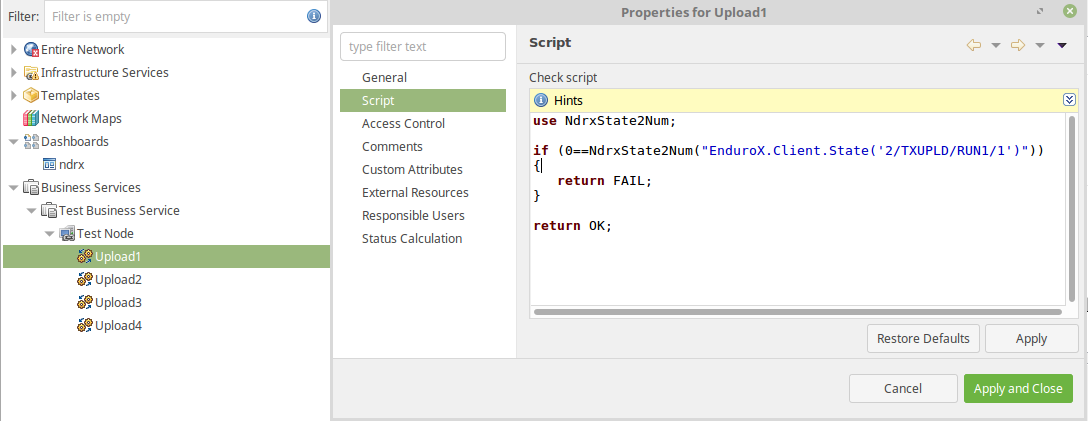
To get the number of service providers (XATMI servers advertising the service) and other aggregated data, analysis will be done on Agent tables, for example "Endurox.ServiceGroups".
Script function will be created which provides following aggregation options:
- min - return min value found for the group;
- max - return max value found in the group;
- avg - return average value of all matched items;
- sum - sum of the matched items.
- cnt - count of the items matched.
Function shall accept following arguments:
- Table name;
- Key column name;
- Key value name;
- Aggregation column name;
So firstly to see the columns available for data analysis, you may use following script (execute server script on the Node, i.e. Shift+Alt+S):
t = AgentReadTable($node, "Endurox.ServiceGroups");

if (null==t)
{
        return "Table is not found? Is Agent configured for Enduro/X?";

}

for (c : t->columns) {
        print(c->name . " | ");
}

println("");

for (row : t->rows) {
        for(cell : row->values) {
                print(cell . " | ");
        }

        println("");
}
Sample output could be:
*** FINISHED ***

Result: (null)

SVCNAME | SRVGROUP | LMID | GROUPNO | RQADDR | STATE | RT_NAME | LOAD | PRIO | COMPLETED | QUEUED | SUCCESSFUL | FAILED | EXECTIME_LAST | EXECTIME_MAX | EXECTIME_MIN |
@CCONF | 2/1 | 2 | 0 |  | ACT |  | 0 | 0 | 0 | 0 | 0 | 0 | 0 | 0 | 0 |
@CCONF | 2/2 | 2 | 0 |  | ACT |  | 0 | 0 | 0 | 0 | 0 | 0 | 0 | 0 | 0 |
.TMIB | 2/10 | 2 | 0 |  | ACT |  | 0 | 0 | 1094 | 0 | 1094 | 0 | 0 | 4000 | 0 |
.TMIB-2-10 | 2/10 | 2 | 0 |  | ACT |  | 0 | 0 | 9 | 0 | 9 | 0 | 0 | 0 | 0 |
.TMIB | 2/11 | 2 | 0 |  | ACT |  | 0 | 0 | 31 | 0 | 31 | 0 | 0 | 2000 | 0 |
.TMIB-2-11 | 2/11 | 2 | 0 |  | ACT |  | 0 | 0 | 5 | 0 | 5 | 0 | 0 | 0 | 0 |
DEBIT | 2/80 | 2 | 0 |  | ACT |  | 0 | 0 | 83649 | 0 | 83649 | 0 | 29000 | 35000 | 0 |
DEBIT | 2/81 | 2 | 0 |  | ACT |  | 0 | 0 | 83629 | 0 | 83629 | 0 | 24000 | 32000 | 0 |
CREDIT | 2/140 | 2 | 0 |  | ACT |  | 0 | 0 | 163463 | 0 | 163463 | 0 | 0 | 6000 | 0 |
CREDIT | 2/141 | 2 | 0 |  | ACT |  | 0 | 0 | 3788 | 0 | 3788 | 0 | 0 | 4000 | 0 |
CREDIT | 2/142 | 2 | 0 |  | ACT |  | 0 | 0 | 27 | 0 | 27 | 0 | 0 | 1000 | 0 |
HANDLER | 2/240 | 2 | 0 |  | ACT |  | 0 | 0 | 55878 | 0 | 55878 | 0 | 36000 | 56000 | 0 |
HANDLER | 2/241 | 2 | 0 |  | ACT |  | 0 | 0 | 55647 | 0 | 55647 | 0 | 29000 | 58000 | 0 |
HANDLER | 2/242 | 2 | 0 |  | ACT |  | 0 | 0 | 55753 | 0 | 55753 | 0 | 32000 | 57000 | 0 |
@CPMSVC | 2/9999 | 2 | 0 |  | ACT |  | 0 | 0 | 1 | 0 | 1 | 0 | 0 | 0 | 0 |
Thus following script function, can be written to get the count of the services advertised:
//Match the table entry, get the count
//@param tableName e.g. "Endurox.ServiceGroups"
//@param keyColName to on which perform testings, to count on, .e.g "SVCNAME"
//@param keyExpr regular expression to match given name, e.g. "^@CCONF$"
//@param aggrFunc aggregation function name - min, max, sum, avg, cnt
//@param aggrCol aggregation column used for min, max, sum and avg.
//@return aggregated value
sub NdrxGet(tableName, keyColName, keyExpr, aggrFunc, aggrCol)
{
        ret = 0;
        t = AgentReadTable($node, tableName);

        if (null==t)
        {
            return null;
        }

        key_col = -1;
        agg_col = -1;

        for(i = 0; i < t->columnCount; i++)
        {
            if (t->getColumnName(i) == keyColName)
            {
                                chk_col=i;
            }
            else if (t->getColumnName(i) == aggrCol)
            {
                agg_col=i;
            }

        }

        //No column found..
        if (-1==chk_col)
        {
                print("ERROR! Key column not found: ".keyColName."\n");
                return null;
        }

        if (-1==agg_col && (aggrFunc=="min" || aggrFunc=="max" || aggrFunc=="sum" || aggrFunc=="avg"))
        {
                print("ERROR! Aggregation column not found: ".aggrCol."\n");
           return null;
        }

        match_rows = 0;
        // Process the data...
        for(i = 0; i < t->rowCount; i++)
        {
            keycolvalue = t->get(i, chk_col);

            if (keycolvalue ~= keyExpr)
            {
                match_rows++;

                if (aggrFunc=="cnt")
                {
                        ret++;
                }
                else
                {
                                data = t->get(i, agg_col);

                                //print("AGG: ".data."\n");

                        if (aggrFunc=="sum" || aggrFunc=="avg")
                        {
                                ret+=data;
                        }
                        else if (aggrFunc=="min")
                        {
                                        if (1==match_rows)
                                        {
                                                ret = data;
                                        }
                                        else if( data < ret )
                                        {
                                                 ret = data;
                                        }
                        }
                        else if (aggrFunc=="max")
                        {
                                        if (1==match_rows)
                                        {
                                                ret = data;
                                        }
                                        else if( data > ret )
                                        {
                                                ret = data;
                                        }
                        }

                        first=0;
                }
            }
        }

        if (0==match_rows && (aggrFunc=="min" || aggrFunc=="max" || aggrFunc=="sum" || aggrFunc=="avg"))
        {
                ret = null;
        }
        else if (aggrFunc=="avg")
        {
                ret = ret/match_rows;
        }

        return ret;
}

//To test:
//return NdrxGet("Endurox.ServiceGroups", "SVCNAME", "^DEBIT$", "sum", "COMPLETED");
//return NdrxGet("Endurox.ServiceGroups", "SVCNAME", "^DEBIT$", "avg", "COMPLETED");
//return NdrxGet("Endurox.ServiceGroups", "SVCNAME", ".TMIB", "min", "COMPLETED");
//return NdrxGet("Endurox.ServiceGroups", "SVCNAME", ".TMIB", "max", "COMPLETED");
//return NdrxGet("Endurox.ServiceGroups", "SVCNAME", ".TMIB", "avg", "COMPLETED");

//To start the script from DCI, we need to actually call it:
//return NdrxGet($1, $2, $3, $4, $5);
Store the script in library as "NdrxGet".
To run "NdrxGet" from DCI, lets create a wrapper script and save it as NdrxGetDci in script library.
use NdrxGet;

//Call this from DCI, pass the arguments
//as: NdrxGet("Endurox.ServiceGroups","SVCNAME","HANDLER","sum","FAILED")
return NdrxGet($1, $2, $3, $4, $5);
To create Some Data Collection Items based on these script, for hosts, DCI items can be created. Document shows how to create following data collection items.
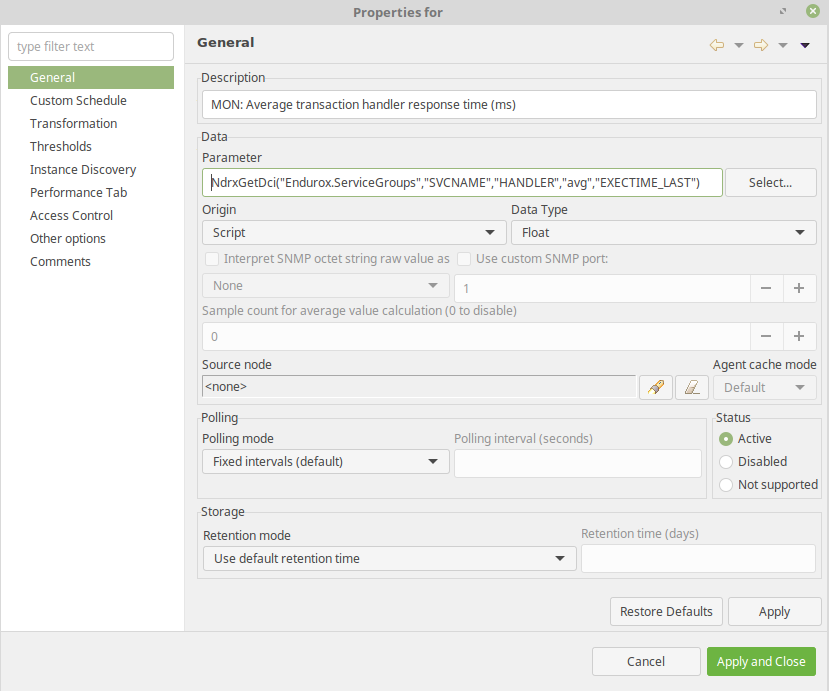
The average response time here is measured for service named "HANDLER".
- DCI Origin: Script;
- Parameter: NdrxGetDci("Endurox.ServiceGroups","SVCNAME","HANDLER","avg","EXECTIME_LAST");
- Data Type: Float
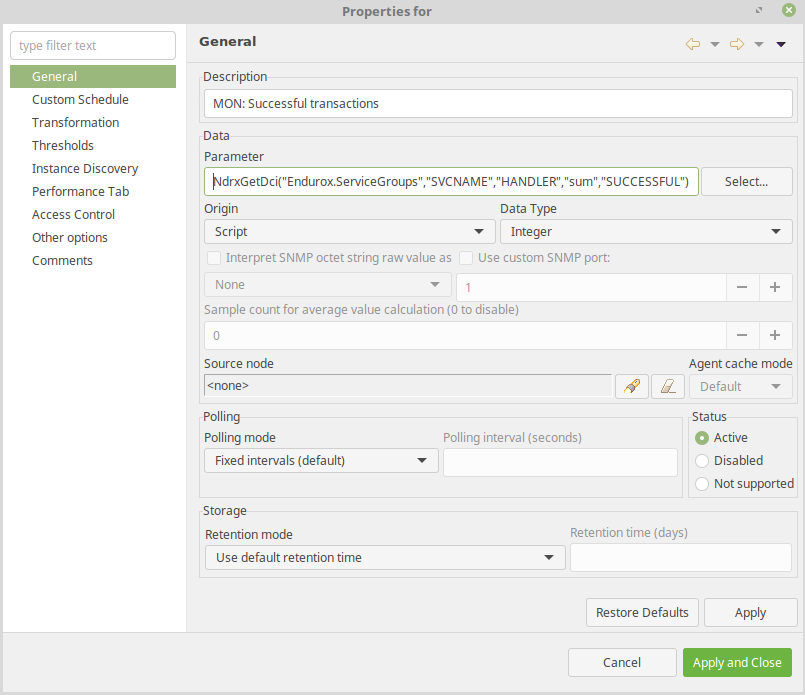
Number of successful messages processed here are measured for "HANDLER" service.
- DCI Origin: Script;
- Parameter: NdrxGetDci("Endurox.ServiceGroups","SVCNAME","HANDLER","sum","SUCCESSFUL")
- Data Type: Integer
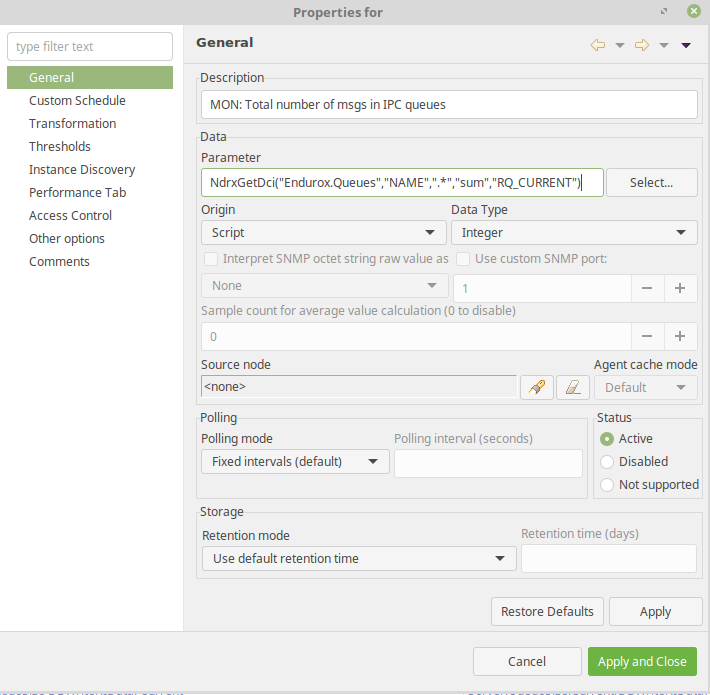
This indicator usually shall be very small like 0..1..2, if it grows higher, then this indicates that system is unable to cope with the workload. This value is recommended to be monitored.
- DCI Origin: Script;
- Parameter: NdrxGetDci("Endurox.Queues","NAME",".*","sum","RQ_CURRENT");
- Data Type: Integer
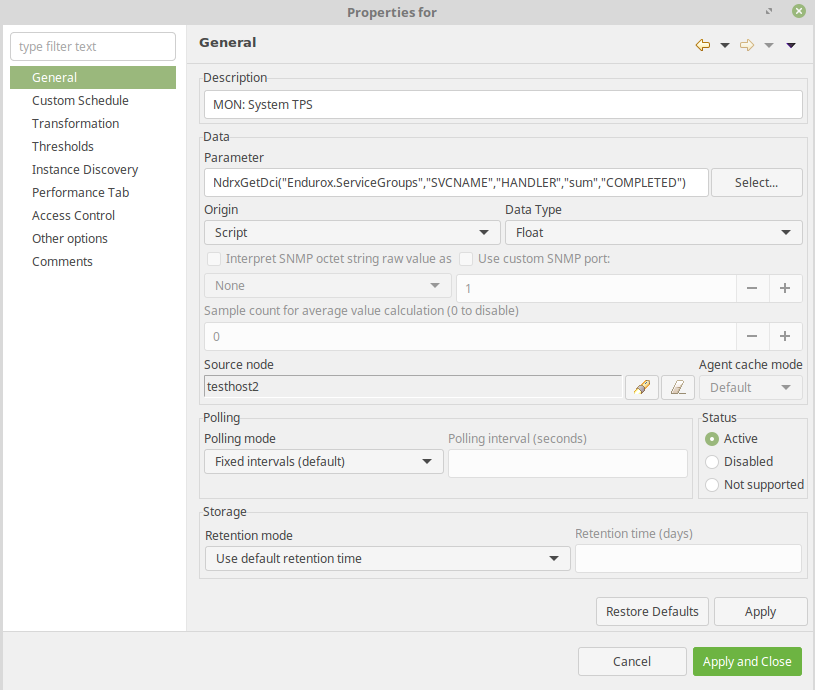
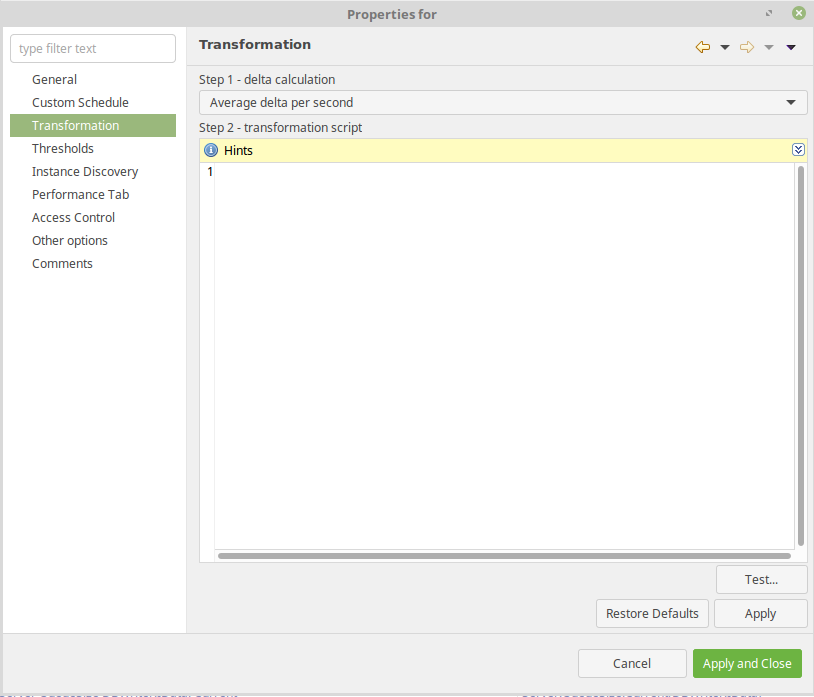
Also it is useful to monitor the number system throughput. This shall be done one some main service which handles all the incoming traffic. In this case service "HANDLER" is monitored.
- DCI Origin: Script;
- Parameter: NdrxGetDci("Endurox.ServiceGroups","SVCNAME","HANDLER","sum","COMPLETED");
- Data Type: Integer
- Transformation: Average delta per second
This section lists additional related documents.
Internet resources
[EX_OVERVIEW] ex_overview(guides)
[EX_ENV] ex_env(5)
[NDRXCONFIG] ndrxconfig.xml(5)
[DEBUGCONF] ndrxdebug.conf(5)
[XADMIN] xadmin(8)
[TPBRIDGE] tpbridge(8)