
Sidebar
endurox:v8.0.x:guides:ex_adminman
Table of Contents
- 1. How to configure Enduro/X
- 2. Setup System
- 3. Setup environment configuration
- 4. Setting up Enduro/X demonstration environment
- 5. Cluster configuration
- 6. Max message size and internal buffer sizes
- 7. Enduro/X Transaction & Message identifier
- 8. Enduro/X Smart Cache
- 9. Configuring distributed transactions support
- 10. Enduro/X Monitoring with SNMP
- 11. Enduro/X Monitoring with NetXMS
- 12. High availability features
- 12.1. Available features
- 12.2. Distributed transactions in a failover environment
- 12.3. Hardware and software requirements for transaction manager failover and transactional message queue
- 12.4. tmqueue queue space in a failover environment
- 12.5. Singleton process groups
- 12.6. Sample configuration of the failover setup with singleton groups
- 12.7. Group-based process startup, stopping and restart
- 12.8. System maintenance
- 13. Standard configuration strings
- 14. Trouble shooting
- Additional documentation
- Glossary
To configure Enduro/X you have to finish several steps.
- Have a separate system user for each Enduro/X instance.
- Setup System Environment (mount mq file system, configure mq params)
- Setup environment configuration
- Setup basic environment (demo)
- Startup the application
Enduro/X supports different back-end message transports. Following mechanisms are available:
- EPOLL (for FreeBSD it is Kqueue) over the Posix queues. This is fastest and most preferred transport mechanism when available. True on queue multiple servers mechanism is supported for different services across different XATMI server binaries (transport code "epoll" for GNU/Linux and "kqueue" for FreeBSD). In case of EPOLL on Linux kernels newer than version 4.5, Enduro/X uses EPOLLEXCLUSIVE flag, so that if on the same XATMI Service queue multiple processes waits for a service call, only one process will be wakened up. For FreeBSD, there is no such flag, thus in case of load-balanced processes there might be extra wakeups (wasted CPU cycles) if multiple idle processes waits/advertises for the same service call. The wasted CPU cycles are small (process wakes up, tries to receive a message, gets EAGAIN error and goes back to poll). The resource wasting might be noticeable if the service TPS load is very high and actual work time for the service is short, and service is load balanced in very high number of processes (for example 250).
- SVAPOLL - This mode is almost equivalent to EPOLL mode, except that System V queues are used. This mode is suitable only for IBM AIX, for which poll() system call accepts System V Queue IDs for polling. What comes with this mode are two additional shared memory mapping tables where where SystemV msgid is mapped to queue string name. And reverse mapping where queue string name is mapped back to msgid. Queue string names are used internally by Enduro/X. In this mode operations and configuration at the Enduro/X level is the same as with epoll mode. Each binary may advertise arbitrary number of services, where each service is shared queue, that may be shared between several other processes which advertise that service. Prior IBM AIX 7.3 poll did not had equivalent functionality of the Linux EPOLLEXCLUSIVE flag, so IBM AIX was prone to the CPU wasting (thundering herd problem) at specific workloads as in FreeBSD (described above). Starting from AIX 7.3 IBM have implemented POLLEXCL flag in AIX for poll() system call. With this new flag Enduro/X on IBM AIX works with the same performance benefits as on the Linux (having true one-queue/multiple-servers topology for all XATMI services). Additional administrative notice: Enduro/X requires that POLLEXCL_POLICY environment variable is set to ONE. Global shell settings are not needed (unless for some special reason, e.g. server started outside ndrxd). If for some reason other value needs to be used for the XATMI server process, that can be set at <envs>/<env> tag in ndrxconfig.xml(5). But recommended way is to use ONE or (ONE:RR as RR is by default). The poll() POLLEXCL usage can be disabled for particular process by setting at NDRX_NOPOLLEXCL to Y at <envs>/<env> tag (Thought this is not recommend, and it will introduce thundering herd issue, if several same type binaries are started). NOTE: that svapoll mode, due to bug in AIX 7.3 (https://www.ibm.com/support/pages/apar/IJ37827), can be used only starting from AIX version 7.3 TL0, SP2 (where the bug is fixed).
- System V message queues, this is generally second best transport available on Linux and Unix operating systems. One queue multiple servers mechanism is available via Request Address option (rqaddr) for XATMI server. The limitation is that each server running on same request address MUST provide all services provided by other servers in same Request Address. This mechanism uses at-least one additional thread per XATMI participant for handling message send/receive time-outs. In case if XATMI server, additional more thread is used for administrative message handling and dispatching to main server thread. Thus compiler must support the multi-threaded operations for user applications (transport code "SystemV"). SystemV Enduro/X builds can be used as alternative for kqueue or svapoll modes, to avoid the CPU wasting associate with extra wakups for idle load balanced same XATMI service servers.
- The third option if POLL over the Posix queues. This uses round-robin approach for message delivery to load balanced servers. One additional thread is used for server process to monitor queues (transport code "poll").
- The forth option is emulated message queue which uses shared memory and process shared Posix locks to emulate the message queue (transport code "emq").
Table 1. Enduro/X IPC transport sub-systems
| Operating System/IPC Transport | epoll | kqueue | systemv | poll | emq | svapoll |
|---|---|---|---|---|---|---|
GNU/Linux | R | X | R | S | S | X |
FreeBSD | X | R | S | S | S | X |
IBM AIX | X | X | S | S | S | R |
Oracle Solaris | X | X | R | S | S | X |
MacOS | X | X | X | X | R | X |
Legend:
S - supported.
R - supported and release provided.
X - not supported.
Each of these IPC transports for particular operating system requires specific approach for configuring the limits and other attributes for runtime.
Note that transport version is built into Enduro/X distribution. Thus to change the IPC transport, different Enduro/X version must be installed (i.e. cannot be changed by parameters). As the ABI for user apps stays the same, the user application is not required to be rebuilt.
The release file for Enduro/X encodes different information. For example file names
- endurox-5.4.1-1.ubuntu18_04_GNU_epoll.x86_64_64.deb
- endurox-5.4.1-1.SUNOS5_10_GNU_SystemV.sparc_64
encodes following information:
Table 2. Enduro/X distribution file name naming conventions
| Product name | Version | Release | OS Name | C Compiler ID | OS Version | IPC Transport | CPU Arch | Target |
|---|---|---|---|---|---|---|---|---|
endurox | 5.4.1 | 1 | Ubuntu | 18.04 | GNU GCC | EPOLL | x86_64 | 64 bit mode |
endurox | 5.4.1 | 1 | SUNOS - Solaris | 5.10 (10) | GNU GCC | System V queues | SPARC | 64 bit mode |
In this chapter will be described typical GNU/Linux system configuration required for Enduro/X. Two sets of configurations are available for Linux OS. One is for Posix queues with epoll and another configuration is System V configuration.
Kernel parameter configuration is needed for Enduro/X runtime. But as we plan here to build the system and run unit-tests, then we need a configuration for runtime.
$ sudo -s
# cat << EOF >> /etc/security/limits.conf

# Do not limit message Q Count.
# Some Linux 3.x series kernels have a bug, that limits 1024
# queues for one system user.
# In 2.6.x and 4.x this is fixed, to have
# unlimited count of queues (memory limit).
# ealrier and later Linuxes have fixed this issue.
*               soft    msgqueue        -1
*               hard    msgqueue        -1

# Increase the number of open files
*               soft    nofile  1024
*               hard    nofile  65536

EOF
# exit
$
This step request mounting of Posix queues and change Posix queue limits
This step does not apply to following Operating Systems - for these continue with next chapter:
- Ubuntu 16.04 and above
- Debian 8.x and above
When running in e-poll mode Enduro/X needs access to virtual file system which provides Posix queue management. One way would be to mount it via "/etc/fstab", but for older system compatibility, we provide instructions that would work for all OSes. To do this automatically at system startup, Linuxes which supports /etc/rc.local, must add following lines before "exit 0".
#!/bin/bash

# Mount the /dev/mqueue
# Not for Debian 8.x: queue is already mounted, thus test:

if [ ! -d /dev/mqueue ]; then
        mkdir /dev/mqueue
        mount -t mqueue none /dev/mqueue
fi

exit 0
Note for Centos/RHEL/Oracle Linux 7+ you need to give execute permissions for rc.local:
# chmod +x /etc/rc.local
Load the configuration by doing:
# /etc/rc.local
Next step is to configure queue limits, this is done by changing Linux kernel parameters, in persistent way, so that new settings are applied at the OS boot.
$ sudo -s

# cat << EOF >> /etc/sysctl.conf

# Max Messages in Queue
fs.mqueue.msg_max=10000

# Max message size, to pass unit tests, use 1M+1K
fs.mqueue.msgsize_max=1049600

# Max number of queues system-wide
fs.mqueue.queues_max=10000

EOF

# Apply kernel parameters now
$ sudo sysctl -f /etc/sysctl.conf

# to check the values, use (print all) and use grep to find:
$ sudo sysctl -a | grep msgsize_max
To pass the Enduro/X unit tests, certain queue configuration is required. Use following kernel settings:
$ sudo -s

# cat << EOF >> /etc/sysctl.conf

# max queues system wide, 32K should be fine
# If more is required, then for some Linux distributions such as Ubuntu 20.04
# kernel boot parameter ipcmni_extend shall be set.
kernel.msgmni=32768

# max size of message (bytes), ~1M should be fine
kernel.msgmax=1049600

# default max size of queue (bytes), ~10M should be fine
kernel.msgmnb=104960000

EOF

# persist the values
$ sudo sysctl -f /etc/sysctl.conf

# Check status...
$ sudo sysctl -a | grep msgmnb
For FreeBSD only officially supported version if Posix queues, thus this operating system requires some settings for these IPC resources to pass the unit testing and also settings are generally fine for average application.
Queue file system must be mounted when OS starts. Firstly we need a folder /mnt/mqueue where the queues are mount. And secondly we will add the automatic mount at system startup in /etc/fstab.
# mkdir /mnt/mqueue
# cat << EOF >> /etc/fstab
null    /mnt/mqueue     mqueuefs             rw      0       0
EOF
# mount /mnt/mqueue
You also need to change the queue parameters:
# cat << EOF >> /etc/sysctl.conf

# kernel tunables for Enduro/X:
kern.mqueue.curmq=1
kern.mqueue.maxmq=30000
kern.mqueue.maxmsgsize=64000
kern.mqueue.maxmsg=1000

EOF

# sysctl -f /etc/sysctl.conf
For LMDB testing more semaphores shall be allowed
# cat << EOF >> /boot/loader.conf

# kernel tunables for Enduro/X:
kern.ipc.semmns=2048
kern.ipc.semmni=500

EOF
After changing /boot/loader.conf, reboot of system is required.
Enduro/X testing framework uses /bin/bash in scripting, thus we must get it working. Also perl is assumed to to be /usr/bin/perl. Thus:
# ln -s /usr/local/bin/bash /bin/bash
# ln -s /usr/local/bin/perl /usr/bin/perl
reboot to apply new settings (limits & mqueue mount)
On the other hand AIX do not require any fine tuning for System V queues, because it is doing automatic adjustments to queue limitations. However to pass the Enduro/X standard unit tests, the security limits must be configured. Unit tests uses standard user "user1" for this purposes. Thus here stack, data mem size, file size and rss sizes are set to unlimited. For example if stack/data/rss is not set correctly, some multi-threaded components of Enduro/X might hang during the startup, for example tpbridge(8).
$ su - root

# cat << EOF >> /etc/security/limits

user1:
        stack = 655360
        data = -1
        rss = -1
        fsize = -1
EOF
If during runtime following errors are faced:
fork: retry: Resource temporarily unavailable
Check that number of user processes are allowed:
$ su - root

# /usr/sbin/lsattr -E -l sys0 | grep maxuproc
maxuproc        40                                 Maximum number of PROCESSES allowed per user        True
Updated to 2000:
# /usr/sbin/chdev -l sys0 -a maxuproc=2000
To pass the Enduro/X unit tests on Solaris, System V queue settings must be applied.
# cat << EOF >> /etc/system
set msgsys:msginfo_msgmni = 10000
set msgsys:msginfo_msgmnb = 10496000

EOF
So here msgmni is maximum number of queues that can be created and msgmnb is single queue maximum size which here is 10MB.
After changing the settings, reboot the server.
OSX does not use require any kernel parameter changes, as emulated message queue is used here. Only it required that sufficient disk space is available to /tmp directory, as the memory mapped queue files will be stored there.
As Enduro/X uses System V shared memory segments, the default sizes are not sufficient for the at least Enduro/X unit testing. Thus limits needs to be changed:
Starting from OS X 10.3.9 the config file is /etc/sysctl.conf, in oder versions use /boot/loader.conf:
$ sudo -s
# cat << EOF >> /etc/sysctl.conf
kern.sysv.shmmax=838860800
kern.sysv.shmmin=1
kern.sysv.shmmni=10000
kern.sysv.shmseg=50
kern.sysv.shmall=204800
kern.maxfiles=524288
kern.maxfilesperproc=262144

EOF
Starting from Macos version 10.15 (Catalina) or later /boot/loader.conf does not work and plist file needs to be installed. Prior making this file, possibly SIP disable is required and root / file system needs to remounted as RW. But firstly may try directly setup this file from root user and only if that does not work, change the SIP mode and perfrom fs-remount.
$ sudo -s

# bash

# cd /Library/LaunchDaemons

# cat << EOF >> endurox.plist
<?xml version="1.0" encoding="UTF-8"?>
<!DOCTYPE plist PUBLIC "-//Apple//DTD PLIST 1.0//EN" "http://www.apple.com/DTDs/PropertyList-1.0.dtd">
<plist version="1.0">
<dict>
 <key>Label</key>
 <string>shmemsetup</string>
 <key>UserName</key>
 <string>root</string>
 <key>GroupName</key>
 <string>wheel</string>
 <key>ProgramArguments</key>
 <array>
 <string>/usr/sbin/sysctl</string>
 <string>-w</string>
 <string>kern.sysv.shmmax=838860800</string>
 <string>kern.sysv.shmmin=1</string>
 <string>kern.sysv.shmmni=10000</string>
 <string>kern.sysv.shmseg=50</string>
 <string>kern.sysv.shmall=204800</string>
 <string>kern.maxfiles=524288</string>
 <string>kern.maxfilesperproc=262144</string>
  </array>
 <key>KeepAlive</key>
 <false/>
 <key>RunAtLoad</key>
 <true/>
</dict>
</plist>
EOF
After above settings reboot is required.
Enduro/X depends lot of Environment variables. See manpage of ex_env ([EX_ENV]) to see all parameters that must be setup. There is also sample configuration provided. Normally it is expected that separate shell script file is setup containing all parameters. Then to load the environment, login with Enduro/X user in, and run following command in your app dir, for example:
$ cd /endurox/app/conf
$ . setapp
This section describes how to create a basic Enduro/X environment. Document will also explain the resources used by Enduro/X from the system setup and administrative perspective. Section will also explain the contents for each of the generated file, so that runtime can be manually reconstructed, which is usable for AIX operating system, as there "xadmin provision" command is not available.
To create generic runtime with Enduro/X "stock" servers processes, use following command:
$ xadmin provision  -d
To control debug output, set debugconfig file path in $NDRX_DEBUG_CONF
N:NDRX:4:00000000:    0:7fc81a75c900:000:20181110:113655631:plugins_load:inbase.c:0180:No plugins defined by NDRX_PLUGINS env variable
N:NDRX:5:00000000:    0:7fc81a75c900:000:20181110:113655631:cconfig_load:config.c:0429:CC tag set to: []
N:NDRX:5:00000000:    0:7fc81a75c900:000:20181110:113655631:x_inicfg_new:inicfg.c:0114:_ndrx_inicfg_new: load_global_env: 1
N:NDRX:5:00000000:    0:7fc81a75c900:000:20181110:113655631:ig_load_pass:config.c:0396:_ndrx_cconfig_load_pass: ret: 0 is_internal: 1 G_tried_to_load: 1
N:NDRX:5:d5d3db3a: 8685:7fc81a75c900:000:20181110:113655632:x_inicfg_new:inicfg.c:0114:_ndrx_inicfg_new: load_global_env: 0
Enduro/X 5.4.1, build Nov  7 2018 08:48:27, using SystemV for LINUX (64 bits)

Enduro/X Middleware Platform for Distributed Transaction Processing
Copyright (C) 2009-2016 ATR Baltic Ltd.
Copyright (C) 2017,2018 Mavimax Ltd. All Rights Reserved.

This software is released under one of the following licenses:
AGPLv3 or Mavimax license for commercial use.

Logging to ./ULOG.20181110

    ______          __                    ___  __
   / ____/___  ____/ /_  ___________    _/_/ |/ /
  / __/ / __ \/ __  / / / / ___/ __ \ _/_/ |   /
 / /___/ / / / /_/ / /_/ / /  / /_/ //_/  /   |
/_____/_/ /_/\__,_/\__,_/_/   \____/_/   /_/|_|

                     Provision

Compiled system type....: LINUX


*** Review & edit configuration ***

 0: Edit qpath        :Queue device path [/dev/mqueue]:
 1: Edit nodeid       :Cluster node id [2]:
 2: Edit qprefix      :System code (prefix/setfile name, etc) [test1]:
 3: Edit timeout      :System wide tpcall() timeout, seconds [90]:
 4: Edit appHome      :Application home [/tmp/demo]:
 6: Edit binDir       :Executables/binaries sub-folder of Apphome [bin]:
 8: Edit confDir      :Configuration sub-folder of Apphome [conf]:
 9: Edit logDir       :Log sub-folder of Apphome [log]:
10: Edit ubfDir       :Unified Buffer Format (UBF) field defs sub-folder of Apphome [ubftab]:
11: Edit tempDir      :Temp sub-dir (used for pid file) [tmp]:
12: Edit installQ     :Configure persistent queue [y]:
13: Edit tmDir        :Transaction Manager Logs sub-folder of Apphome [tmlogs]:
14: Edit qdata        :Queue data sub-folder of Apphone [qdata]:
15: Edit qSpace       :Persistent queue space namme [SAMPLESPACE]:
16: Edit qName        :Sample persistent queue name [TESTQ1]:
17: Edit qSvc         :Target service for automatic queue for sample Q [TESTSVC1]:
18: Edit eventSv      :Install event server [y]:
19: Edit cpmSv        :Configure Client Process Monitor Server [y]:
20: Edit configSv     :Install Configuration server [y]:
21: Edit bridge       :Install bridge connection [y]:
22: Edit bridgeRole   :Bridge -> Role: Active(a) or passive(p)? [a]:
24: Edit ipc          :Bridge -> IP: Connect to [172.0.0.1]:
25: Edit port         :Bridge -> IP: Port number [21003]:
26: Edit otherNodeId  :Other cluster node id [2]:
27: Edit ipckey       :IPC Key used for System V semaphores [44000]:
28: Edit ldbal        :Load balance over cluster [0]:
29: Edit ndrxlev      :Logging: ATMI sub-system log level 5 - highest (debug), 0 - minimum (off) [5]:
30: Edit ubflev       :Logging: UBF sub-system log level 5 - highest (debug), 0 - minimum (off) [1]:
31: Edit tplev        :Logging: /user sub-system log level 5 - highest (debug), 0 - minimum (off) [5]:
32: Edit usv1         :Configure User server #1 [n]:
50: Edit ucl1         :Configure User client #1 [n]:
55: Edit addubf       :Additional UBFTAB files (comma seperated), can be empty []:
56: Edit msgsizemax   :Max IPC message size [56000]:
57: Edit msgmax       :Max IPC messages in queue [100]:
ndrxconfig: [/tmp/demo/conf/ndrxconfig.xml]
appini: [/tmp/demo/conf/app.ini]
setfile: [/tmp/demo/conf/settest1]


To start your system, run following commands:
$ cd /tmp/demo/conf
$ source settest1
$ xadmin start -y


Provision succeed!
During the provision following directory structure was created at the project root which is "/tmp/demo", where the following data is intended to be stored:
Table 3. Enduro/X distribution file name naming conventions
| Directory | File stored |
|---|---|
ubftab | UBF field tables |
tmlogs/rm1 | transaction manager logs, sub-folder for resource manager 1 |
conf | configuration files |
bin | program binaries (executables) |
qdata | persistent queue data |
tmp | temporary files like pid file, etc. |
log | Enduro/X and user log files |
If demo needs to be started on AIX os, then these folders needs to be created by hand.
The most interesting thing at the given step is the configuration files. The provision generates the following list of files in "conf" folder:
Table 4. Enduro/X typical application configuration files
| Directory | File stored |
|---|---|
app.ini | Application configuration |
ndrxconfig.xml | Application server process configuration |
settest1 | Bash script for setting the Enduro/X environment |
Next chapters describe contents for each of the configuration files
This file contains global settings (which alternatively can be set as environment variables, see ex_env(5)) in section [@global]. app.ini also contains debug configuration in section [@debug] (which alternatively can be configured in separated file, see ndrxdebug.conf(5)). The ini file is also used by other Enduro/X services like persistent queues, defined in [@queue]. The ini files allows sections to inherit settings from parents sections. The sub-sections can be configuration at process level with NDRX_CCTAG env variable, or this can be done in ndrxconfig.xml at <cctag /> XML tag for XATMI servers and cctag attribute for CPMSRV clients.
The demo app.ini section looks like:
[@global]
NDRX_CLUSTERISED=1
NDRX_CMDWAIT=1
NDRX_CONFIG=${NDRX_APPHOME}/conf/ndrxconfig.xml
NDRX_DMNLOG=${NDRX_ULOG}/ndrxd.log
NDRX_DPID=${NDRX_APPHOME}/tmp/ndrxd.pid
NDRX_DQMAX=100
NDRX_IPCKEY=44000
NDRX_LDBAL=0
NDRX_LEV=5
NDRX_LOG=${NDRX_ULOG}/xadmin.log
NDRX_MSGMAX=100
NDRX_MSGSIZEMAX=56000
NDRX_NODEID=2
NDRX_QPATH=/dev/mqueue
NDRX_QPREFIX=/test1
NDRX_RNDK=0myWI5nu
NDRX_SRVMAX=10000
NDRX_SVCMAX=20000
NDRX_TOUT=90
NDRX_UBFMAXFLDS=16000
NDRX_ULOG=${NDRX_APPHOME}/log
FIELDTBLS=Exfields
FLDTBLDIR=${NDRX_APPHOME}/ubftab

; Environment for Transactional Queue
[@global/RM1TMQ]
NDRX_XA_RES_ID=1
NDRX_XA_OPEN_STR=${NDRX_APPHOME}/qdata
NDRX_XA_CLOSE_STR=${NDRX_APPHOME}/qdata
NDRX_XA_DRIVERLIB=libndrxxaqdisks.so
; dylib needed for osx
NDRX_XA_RMLIB=libndrxxaqdisk.so
NDRX_XA_LAZY_INIT=0

[@debug]
; * - goes for all binaries not listed bellow
*= ndrx=5 ubf=1 tp=5 file=
xadmin= ndrx=5 ubf=1 tp=5 file=${NDRX_ULOG}/xadmin.log
ndrxd= ndrx=5 ubf=1 tp=5 file=${NDRX_ULOG}/ndrxd.log

; Queue definitions goes here, see man q.conf(5) for syntax
[@queue]
; Default manual queue (reserved name '@'), unknown queues are created based on this template:
@=svcnm=-,autoq=n,waitinit=0,waitretry=0,waitretryinc=0,waitretrymax=0,memonly=n,mode=fifo

[@queue/RM1TMQ]
; Sample queue (this one is automatic, sends messages to target service)
TESTQ1=svcnm=TESTSVC1,autoq=y,tries=3,waitinit=1,waitretry=1,waitretryinc=2,waitretrymax=5,memonly=n,mode=fifo
The above also describes the configuration for Resource Manager 1 - which is used by persistent message queue. The Resource manager settings applies at global level and one process may only work with one RM, thus processes operating with particular Resource Manager, shall use CCTAG "RM1TMQ".
The demo system does not include any user processes, but almost all Enduro/X distributed special services are configuration. The configuration of system processes looks almost the same as for user processes, thus this gives some insight on how to configure the system.
<?xml version="1.0" ?>
<endurox>
<!--
    *** For more info see ndrxconfig.xml(5) man page. ***
-->
    <appconfig>
        <!--
            ALL BELLOW ONES USES <sanity> periodical timer
            Sanity check time, sec
        -->
        <sanity>1</sanity>

        <!--
            Seconds in which we should send service refresh to other node.
        -->
        <brrefresh>5</brrefresh>

        <!--
            Do process reset after 1 sec
        -->
        <restart_min>1</restart_min>

        <!--
            If restart fails, then boot after +5 sec of previous wait time
        -->
        <restart_step>1</restart_step>

        <!--
            If still not started, then max boot time is a 30 sec.
        -->
        <restart_max>5</restart_max>

        <!--
            <sanity> timer, usage end
        -->

        <!--
        Time (seconds) after attach when program will start do sanity & respawn checks,
        starts counting after configuration load
        -->
        <restart_to_check>20</restart_to_check>


        <!--
            Setting for pq command, should ndrxd collect service
            queue stats automatically If set to Y or y,
            then queue stats are on. Default is off.
        -->
        <gather_pq_stats>Y</gather_pq_stats>

    </appconfig>
    <defaults>

        <min>1</min>
        <max>2</max>
        <!--
            Kill the process which have not started in <start_max> time
        -->
        <autokill>1</autokill>

        <!--
            The maximum time while process can hang in 'starting' state i.e.
            have not completed initialization, sec X <= 0 = disabled
        -->
        <start_max>10</start_max>

        <!--
            Ping server in every X seconds (step is <sanity>).
        -->
        <pingtime>100</pingtime>

        <!--
            Max time in seconds in which server must respond.
            The granularity is sanity time.
            X <= 0 = disabled
        -->
        <ping_max>800</ping_max>

        <!--
            Max time to wait until process should exit on shutdown
            X <= 0 = disabled
        -->
        <end_max>10</end_max>

        <!--
            Interval, in seconds, by which signal sequence -2, -15, -9, -9.... will be sent
            to process until it have been terminated.
        -->
        <killtime>1</killtime>

    </defaults>
    <servers>
        <server name="cconfsrv">
            <min>2</min>
            <max>2</max>
            <srvid>1</srvid>
            <sysopt>-e ${NDRX_ULOG}/cconfsrv.log -r</sysopt>
        </server>
        <server name="tpevsrv">
            <min>2</min>
            <max>2</max>
            <srvid>20</srvid>
            <sysopt>-e ${NDRX_ULOG}/tpevsrv.log -r</sysopt>
        </server>
        <server name="tmsrv">
            <min>3</min>
            <max>3</max>
            <srvid>40</srvid>
            <cctag>RM1TMQ</cctag>
            <sysopt>-e ${NDRX_ULOG}/tmsrv-rm1.log -r -- -t1 -l${NDRX_APPHOME}/tmlogs/rm1</sysopt>
        </server>
        <server name="tmqueue">
            <min>1</min>
            <max>1</max>
            <srvid>60</srvid>
            <cctag>RM1TMQ</cctag>
            <sysopt>-e ${NDRX_ULOG}/tmqueue-rm1.log -r -- -m SAMPLESPACE -s1</sysopt>
        </server>
        <server name="tpbridge">
            <min>1</min>
            <max>1</max>
            <srvid>150</srvid>
            <sysopt>-e ${NDRX_ULOG}/tpbridge_2.log -r</sysopt>
            <appopt>-f -n2 -r -i 172.0.0.1 -p 21003 -tA -z30</appopt>
        </server>
        <server name="cpmsrv">
            <min>1</min>
            <max>1</max>
            <srvid>9999</srvid>
            <sysopt>-e ${NDRX_ULOG}/cpmsrv.log -r -- -k3 -i1</sysopt>
        </server>
    </servers>
    <!--
        Client section
    -->
    <clients>
        <!--
            Test parameter passing to process
            - To list clients:$ xadmin pc
            - To stop client: $ xadmin sc -t TAG1 -s SUBSECTION1
            - To boot client: $ xadmin bc -t TAG1 -s SUBSECTION1
        -->
        <client cmdline="your_test_binary.sh -t ${NDRX_CLTTAG} -s ${NDRX_CLTSUBSECT}">
            <exec tag="TAG1" subsect="SUBSECTION1" autostart="Y" log="${NDRX_ULOG}/testbin-1.log"/>
            <exec tag="TAG2" subsect="SUBSECTION2" autostart="Y" log="${NDRX_ULOG}/testbin-3.log"/>
        </client>
        <client cmdline="your_test_binary2.sh -t ${NDRX_CLTTAG}">
            <exec tag="TAG3" autostart="Y" log="${NDRX_ULOG}/testbin2-1.log"/>
        </client>
    </clients>
</endurox>
The above configuration includes the maximum settings which are by default on from the provision script. This includes configuration servers (cconfsrv(8)) - which allows to download the configuration from ini files by standard tpcall(3) command. Then it also includes event server, persistent queue and transaction manager for persistent queue. Bridge connection, configured as active (client) side is added and client process monitor (cpmsrv(8)) is started with server id 9999. Thus once cpmsrv is booted, it will start the processes from "<clients/>" tag.
To setup cluster see you have to setup bridge ATMI processes on each of the machines. See [TPBRIDGE] documentation to have understanding of clustering. Sample setup of cluster node which actively connects to Node 2 and waits call from Node 12 could look like:
<?xml version="1.0" ?>
<endurox>
    <appconfig>
        <sanity>10</sanity>
        <brrefresh>6</brrefresh>
        <restart_min>1</restart_min>
        <restart_step>1</restart_step>
        <restart_max>5</restart_max>
        <restart_to_check>20</restart_to_check>
    </appconfig>
    <defaults>
        <min>1</min>
        <max>2</max>
        <autokill>1</autokill>
        <respawn>1<respawn>
        <start_max>2</start_max>
        <pingtime>1</pingtime>
        <ping_max>4</ping_max>
        <end_max>3</end_max>
        <killtime>1</killtime>
    </defaults>
    <servers>
        <!-- Connect to cluster node 2, we will wait for call -->
        <server name="tpbridge">
            <max>1</max>
            <srvid>101</srvid>
            <sysopt>-e /tmp/BRIDGE002 -r</sysopt>
            <appopt>-n2 -r -i 0.0.0.0 -p 4433 -tP -z30</appopt>
        </server>
        <!-- Connect to cluster node 12, we try to connect activetly to it -->
        <server name="tpbridge">
            <max>1</max>
            <srvid>102</srvid>
            <sysopt>-e /tmp/BRIDGE012 -r</sysopt>
            <appopt>-n12 -r -i 195.122.24.13 -p 14433 -tA -z30</appopt>
        </server>
    </servers>
</endurox>The startup is straight forward. The environment variables needs to be loaded either by source command or by dot (.) notation.
$ cd /tmp/demo/conf
$ source settest1
$ xadmin start -y
Enduro/X 5.4.1, build Nov  7 2018 08:48:27, using SystemV for LINUX (64 bits)

Enduro/X Middleware Platform for Distributed Transaction Processing
Copyright (C) 2009-2016 ATR Baltic Ltd.
Copyright (C) 2017,2018 Mavimax Ltd. All Rights Reserved.

This software is released under one of the following licenses:
AGPLv3 or Mavimax license for commercial use.

* Shared resources opened...
* Enduro/X back-end (ndrxd) is not running
* ndrxd PID (from PID file): 18037
* ndrxd idle instance started.
exec cconfsrv -k 0myWI5nu -i 1 -e /tmp/demo/log/cconfsrv.log -r --  :
        process id=18041 ... Started.
exec cconfsrv -k 0myWI5nu -i 2 -e /tmp/demo/log/cconfsrv.log -r --  :
        process id=18045 ... Started.
exec tpevsrv -k 0myWI5nu -i 20 -e /tmp/demo/log/tpevsrv.log -r --  :
        process id=18049 ... Started.
exec tpevsrv -k 0myWI5nu -i 21 -e /tmp/demo/log/tpevsrv.log -r --  :
        process id=18053 ... Started.
exec tmsrv -k 0myWI5nu -i 40 -e /tmp/demo/log/tmsrv-rm1.log -r -- -t1 -l/tmp/demo/tmlogs/rm1 --  :
        process id=18057 ... Started.
exec tmsrv -k 0myWI5nu -i 41 -e /tmp/demo/log/tmsrv-rm1.log -r -- -t1 -l/tmp/demo/tmlogs/rm1 --  :
        process id=18072 ... Started.
exec tmsrv -k 0myWI5nu -i 42 -e /tmp/demo/log/tmsrv-rm1.log -r -- -t1 -l/tmp/demo/tmlogs/rm1 --  :
        process id=18087 ... Started.
exec tmqueue -k 0myWI5nu -i 60 -e /tmp/demo/log/tmqueue-rm1.log -r -- -m SAMPLESPACE -s1 --  :
        process id=18102 ... Started.
exec tpbridge -k 0myWI5nu -i 150 -e /tmp/demo/log/tpbridge_2.log -r -- -f -n2 -r -i 172.0.0.1 -p 21003 -tA -z30 :
        process id=18137 ... Started.
exec cpmsrv -k 0myWI5nu -i 9999 -e /tmp/demo/log/cpmsrv.log -r -- -k3 -i1 --  :
        process id=18146 ... Started.
Startup finished. 10 processes started.
The application instance is started!
Starting from Enduro/X version 5.1+, the max message size what can be transported over the XATMI sub-system is limited to the operating system’s queue settings. For example on Linux kernel 3.13 the message size limit (/proc/sys/fs/mqueue/msgsize_max) is around 10 MB. The message size is configured with NDRX_MSGMAX environment variable, see ex_env(5) man page.
Also regarding the buffer sizes, when NDRX_MSGMAX is set bellow 64K, the buffer size is fixed to 64K, this means that operations like network packet size when using tpbridge, is set to 64K.
As the message size is at the same time as a internal buffer size, this means that not all space can be used by sending some data (for example CARRAY or UBF buffer). Some overhead is added by Enduro/X, message headers, and for bridge protocol format extra data is added for TLV structure. Thus to be safe, for example, if expected data size is 64K, then the message size (NDRX_MSGMAX) should be set to something like 80KB.
Enduro/X generates 16 byte long custom CID (Enduro/X cluster ID) identifier for following purposes:
- Global Transaction ID
- TMQ Message ID.
The CID is composed of the following parts:
- Byte 1: Enduro/X cluster node id (NDRX_NODEID).
- Bytes 2-5: PID of the process generated CID, in network order.
- Bytes 6: tv_usec youngest bits 7..14
- Bytes 7-9: Sequence counter, the start value is randomized during process init, in network order.
- Bytes 9 (oldest 7 bits): tv_usec youngest bits 0..6
- Bytes 9 (youngest bit 1)-14: 33 bit Unix echo time stamp in seconds, in network order.
- Bytes 14-16: Random number.
Random is generated by rand_r(), the start is randomized by time/pid/uid/time and /dev/urandom or /dev/random (if available). The CID guarantees that 16 million transaction IDs/TMQ IDs per second would be unique within the cluster, executed by a single process.
In case if OS has 64bit pid_t (such as AIX), the TMSRV and TMQUEUE include additionally in identifiers srvid, which shall cope with the cases if some PIDs gets youngest 4 bytes equal.
If the administrator changes the time on the operating system backwards (manually, not by NTP), then sequence counter and random number shall protect against duplicates.
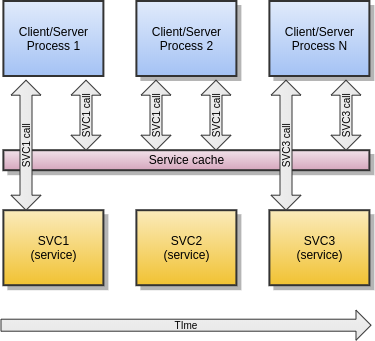
Enduro/X support SOA level cache. This means that administrator can configure system configuration, so that certain services are cached. Thus if some client process calls some service X, and it gets valid results back, then data key is built (specified in config) and for this key data is saved to Lightning Memory-Mapped Database (LMDB). Next time service is called, the cache is checked, again, key is built, and lookup to LMDB is made. If results are found in db, then actual service is X is not called, but instead saved buffer from cache is returned back to caller. Cache works for tpcall() function.
Cache supports different features:
- Limited or unlimited caches are available. The unlimited cache is bound to physical dimensions of db file (also specified in configuration). In case of limited cache, number of logical items stored in cache can be specified. This is set by limit parameter for database configuration. In case if limit is specified the strategy how to remove over-reached records can be specified in database flags. The strategies supported are following: LRU - keep records recently used, FIFO - delete records by chronological order (older records added to cache are being deleted), HITS - records mostly accessed stays in cache.
- Multiple physical storage definitions, so that XATMI services can be allocated in different or same physical storage. This can help to solve challenges between storage space limitations and performance limitations (when multiple writes are done in same physical storage).
- Cache is Enduro/X cluster aware. Records can be distributed and deleted across the cluster nodes. Time based sync is supported when in the same time both nodes adds records to non existing cache cell. On both cluster nodes will survive record which is fresher. The older duplicate is zapped by tpcall() or by tpcached.
- Records can be grouped for example statement pages can be all linked to single user. If transaction happens for user, then whole group can be invalidated. Thus build cache again. Grouping can be also used for Denial Of Service (DoS) protection. Enduro/X can be configured to limit the max number of new records in group, after which any new non existing data element lookup in group will make request buffer to reject with configured tperrno, user return code and buffer.
- Records in cache can be cross-invalidated. Meaning that "hooks" can be put on certain service calls in order to invalidate - zap contents of some other cache.
- Cache supports refresh conditions. So that in case if specific condition over the data is true, the cached data not returned, but service invocation is performed and re-cached (old data overwritten).
The LMDB is build in such way that if write transaction on the database is open, then other writes will not be able to process it in meantime. While read only transactions are processed, while some other process holds write transaction. Also if process which is holding the lock is crashed (e.g. segfaul, kill, etc..), then lock is automatically made free. Thus for example is using hits or lru limitation caches, then this automatically means that during the tpcall() caches needs to be updated, thus lock is needed, and this means that all callers will have to sync in that place - thus makes point of bottleneck.
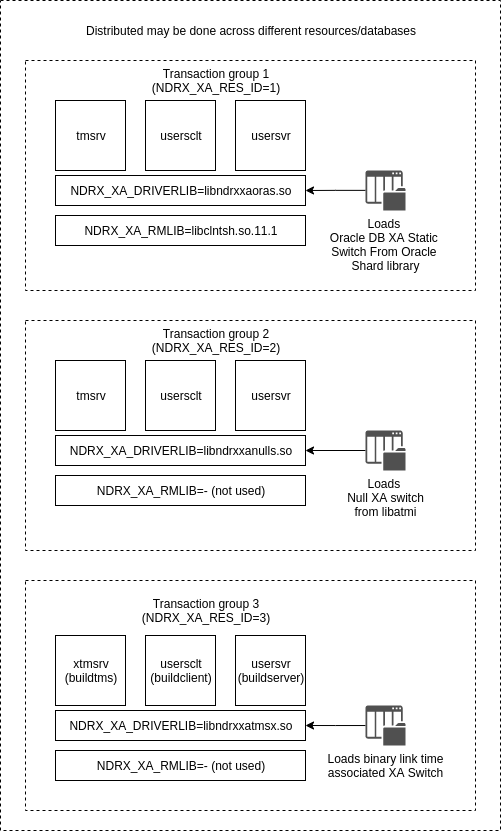
Enduro/X supports two phase commit - distributed transactions. System provides configuration interface for enabling up to 255 transaction groups. Transaction group basically is set of credentials how to connect to database. From XA point of view, group represents a transaction branch. Typically for the same transaction branch, resources (databases, queues, etc.) allows only one process to be active on particular transaction within the branch. Thus if several processes needs to do the work in global transaction, either processes must be located in different groups, or within same groups processes must perform transaction suspend before continuing with other process.
Enduro/X configuration for distributed transactions uses following terminology:
XA Driver Lib - this is set of libraries shipped with Enduro/X. These libraries are interface between database specifics and the Enduro/X. Basically these are adapter for wider range of different resources. Typically they resolve the XA switch in resource specific way. Thus adding new XA resource to Enduro/X shall not be a big change, just writing XA Switch resolve function, typically few code lines. Driver library is configured in NDRX_XA_DRIVERLIB environment variable.
Following drivers (shared libraries .so or .dylib) are shipped with Enduro/X distribution:
- libndrxxadb2s (for static reg) and libndrxxadb2d (for dynamic reg) - Loads IBM DB2 Resource Manager. Resource manager driver is loaded from library set in NDRX_XA_RMLIB env variable.
- libndrxxaoras(8) (for static reg / "xaosw") and libndrxxaorad (for dynamic reg / "xaoswd") - Loads Oracle DB Resource Manager. Resource manager driver is loaded from library set in NDRX_XA_RMLIB env variable.
- libndrxxanulls(8) - null switch (tmnull_switch). This basically allows processes to participate in global transaction, but without any linkage to any real resource managers. The NDRX_XA_RMLIB parameter shall be set to "-" (indicate that value is empty).
- libndrxxapq(8) (PQ Driver) and libndrxxaecpg(8) (ECPG/PQ Driver) - these drivers emulates XA switch for PostgreSQL. The resource manager driver in NDRX_XA_RMLIB shall be set to "-". The libpq is pulled in my Enduro/X driver dependencies.
libndrxxatmsx(8) (Built in XA Switch with help of ndrx_xa_builtin_get() func)
- this resolves XA switch from process built-in symbols. Built in symbols can be added to process by using buildserver(8),buildclient(8) and buildtms(8). If built in switch is not compiled in, then NULL switch is returned. For server processes the built in handler is provided by libatmisrvinteg. The pointer to XA Switch can be passed to _tmstartserver() entry point function. Usually the entry point call is generated by buildserver program.
- libndrxxawsmqs(8) (for static reg) and libndrxxawsmqd(8) (for dynamic reg) - IBM WebSphere MQ XA Driver loader. The NDRX_XA_RMLIB shall be set to libmqmxa64_r.so.
Different configuration of transaction groups:
Transaction groups are configured in environment variables. Enduro/X stores configuration files in ini files in section [@global]. Subsections are used to define different groups. These sub-sections then via NDRX_CCTAG env variable (or CCTAG in ndrxconfig.xml(5)) can be assigned to different processes. The full list of env variables and their function can be seen in ex_env(5) man page.
XA Group configuration consists of following env variables:
- NDRX_XA_RES_ID - mandatory parameter, this is group number.
- NDRX_XA_OPEN_STR - mandatory parameter, driver open string.
- NDRX_XA_CLOSE_STR - mandatory parameter, driver close string.
- NDRX_XA_DRIVERLIB - mandatory parameter, Enduro/X resource driver loader.
- NDRX_XA_RMLIB - mandatory parameter, Resource manager driver (if any). For empty used "-".
- NDRX_XA_LAZY_INIT - optional, if set to 1 XA at process level will be initialized only when functionality is used.
- NDRX_XA_FLAGS - optional, reconnect flags and other XA switch work mode flags may be configured here.
The following configuration example will show example for 4 processes which will each live in it’s own transaction group. Groups and processes will be following:
- Group 1: Client process will operate with NULL switch (test_nullcl).
- Group 2: Server process will operate with Oracle DB (test_orasv).
- Group 3: Server process will operate with PostgreSQL DB (test_pgsv).
- Group 4: TMQ transactional persistent queue sub-system (tmqueue queue server).
Following environment sub-sections/groups will be defined in app.ini:
#
# Group 1 Null switch
#
[@global/Group1]
NDRX_XA_RES_ID=1
NDRX_XA_OPEN_STR=-
NDRX_XA_CLOSE_STR=-
NDRX_XA_DRIVERLIB=libndrxxanulls.so
NDRX_XA_RMLIB=-
NDRX_XA_LAZY_INIT=1

#
# Group 2 Oracle DB
#
[@global/Group2]
NDRX_XA_RES_ID=2
NDRX_XA_OPEN_STR="ORACLE_XA+SqlNet=ROCKY+ACC=P/endurotest/endurotest1+SesTM=180+LogDir=/tmp/xa+nolocal=f+Threads=true"
NDRX_XA_CLOSE_STR=${NDRX_XA_OPEN_STR}
NDRX_XA_DRIVERLIB=libndrxxaoras.so
NDRX_XA_RMLIB=/u01/app/oracle/product/11.2.0/dbhome_1/lib/libclntsh.so.11.1
NDRX_XA_LAZY_INIT=1

#
# Group 3 PostgreSQL
#
[@global/Group3]
NDRX_XA_RES_ID=3
NDRX_XA_OPEN_STR={"url":"postgresql://testuser:testuser1@localhost:5432/testdb"}
NDRX_XA_CLOSE_STR=${NDRX_XA_OPEN_STR}
NDRX_XA_DRIVERLIB=libndrxxapq.so
NDRX_XA_RMLIB=−
NDRX_XA_LAZY_INIT=1


#
# Group 4 TMQ
#
[@global/Group4]
NDRX_XA_RES_ID=4
NDRX_XA_OPEN_STR=datadir="${NDRX_APPHOME}/queues/QSPACE1",qspace="QSPACE1"
NDRX_XA_CLOSE_STR=$NDRX_XA_OPEN_STR
NDRX_XA_DRIVERLIB=libndrxxaqdisks.so
NDRX_XA_RMLIB=libndrxxaqdisk.so
NDRX_XA_LAZY_INIT=0
The following environment sub-sections/groups will be defined in ndrxconfig.xml. Configuration file defines Transaction Manager Server for each of the groups. tmsrv(8) dynamically loaded (or build with buildtms) is must have for each of the group:
<?xml version="1.0" ?>
<endurox>
    <appconfig>
        ...
    </appconfig>
    <defaults>
        ...
    </defaults>
    <servers>
        <server name="tmsrv">
            <srvid>50</srvid>
            <min>1</min>
            <max>1</max>
            <cctag>Group1</cctag>
            <sysopt>-e ${NDRX_ULOG}/TM1.log -r -- -t60 -l${NDRX_APPHOME}/tmlogs/rm1 </sysopt>
        </server>

        <server name="tmsrv">
            <srvid>150</srvid>
            <min>1</min>
            <max>1</max>
            <cctag>Group2</cctag>
            <sysopt>-e ${NDRX_ULOG}/TM1.log -r -- -t60 -l${NDRX_APPHOME}/tmlogs/rm2 </sysopt>
        </server>

        <server name="tmsrv">
            <srvid>250</srvid>
            <min>1</min>
            <max>1</max>
            <cctag>Group3</cctag>
            <sysopt>-e ${NDRX_ULOG}/TM1.log -r -- -t60 -l${NDRX_APPHOME}/tmlogs/rm3 </sysopt>
        </server>

        <server name="tmsrv">
            <srvid>350</srvid>
            <min>1</min>
            <max>1</max>
            <cctag>Group4</cctag>
            <sysopt>-e ${NDRX_ULOG}/TM1.log -r -- -t60 -l${NDRX_APPHOME}/tmlogs/rm4 </sysopt>
        </server>

        <server name="test_orasv">
            <srvid>400</srvid>
            <cctag>Group2</cctag>
            <sysopt>-e ${NDRX_ULOG}/test_orasv.log -r</sysopt>
        </server>

        <server name="test_pgsv">
            <srvid>500</srvid>
            <cctag>Group3</cctag>
            <sysopt>-e ${NDRX_ULOG}/test_pgsv.log -r</sysopt>
        </server>

        <server name="tmqueue">
            <max>1</max>
            <srvid>600</srvid>
            <cctag>Group4</cctag>
            <sysopt>-e ${NDRX_ULOG}/tmqueue.log -r -- -s1</sysopt>
        </server>

    </servers>
    <clients>
        <client cmdline="test_nullcl" CCTAG="Group1">
            <exec tag="NULLCL" autostart="Y" log="${NDRX_ULOG}/testnullbin.log"/>
        </client>
    </clients>
</endurox>
Once a application is started, any other process may be started in the specific transaction group by providing the environment variable first. For example to run the process in Oracle DB Environment (which is group 2), do the following on shell:
$ NDRX_CCTAG=Group2 ./test_oracl
Note that this configuration assumes that following folders are created:
- ${NDRX_APPHOME}/tmlogs/rm[1,2,3,4] - Transaction manager machine readable logs for transaction completion and recovery.
- ${NDRX_APPHOME}/queues/QSPACE1 - Folder for persistent queue data storage.
SNMP monitoring is provided by Enduro/X Enterprise Edition module, details are described in endurox-ee module documentation.
NetXMS monitoring tool has the agent plugin for Enduro/X. This section will describe the basic elements how to monitor Enduro/X with help of this tool
Enduro/X exposes the following list of the tables which can monitor:
- Endurox.Clients - information about client processes.
- Endurox.Machines - information about cluster machines.
- Endurox.Queues - information about local queues.
- Endurox.ServerInstances - information about XATMI server processes.
- Endurox.ServiceGroups - dynamic information about XATMI services.
- Endurox.Services - static information about XATMI services.
To start the Enduro/X monitoring with the NetXMS, firstly the agent must be compiled with Enduro/X support. Thus the system has to have compiler installed and access to Internet must be (for fetching the sources from the github).
To build the agent, system must have C/C++ compiler installed and "git" tool too. Basically if Enduro/X build dependencies are met on the host, then Netxms agent will build too. For more details consult with the project specific documentation.
But in general, to build the agent for Enduro/X, do the following steps:
$ git clone https://github.com/netxms/netxms
$ cd netxms
$ ./reconf
$ ./configure --with-agent --prefix=/path/to/install --with-tuxedo=/usr --disable-mqtt
$ make
$ sudo make install
If doing basic setup, then usually you need to setup the configuration file for agent to allow the incoming servers connections, for example:
# cat << EOF > /etc/nxagentd.conf

LogFile=/var/log/nxagentd

# IP white list, can contain multiple records separated by comma.
# CIDR notation supported for subnets.
MasterServers=127.0.0.0/8,172.17.0.1,192.168.43.98
ServerConnection=192.168.43.98
SubAgent=tuxedo.nsm

EOF
Once configuration is done, the nxagentd shall be started from Enduro/X environment, so that agent will be able to call tpadmsv(8) services. Usually agent is started from cpmsrv(8).
To start the agent manually, following commands may be used:
$ cd /path/to/install/bin

-- have some debug in current session:
$ ./nxagentd -D5

-- or to start as deamon:
$ ./nxagentd -D5
In case of CPMSRV, following can be used as configuration:
...
    <!-- Client section -->
    <clients>
...
        <client cmdline="/path/to/install/bin/nxagentd -D5 -c/etc/nxagentd.conf" log="/tmp/nxagentd.log">
                <exec tag="NXAGENT" autostart="Y" />
        </client>
...
</clients>To check the list parameters that can be monitored, use following command:
$ nxget -l <agent ip addr>  Agent.SupportedParameters
...
Endurox.Client.ActiveConversations(*)
Endurox.Client.ActiveRequests(*)
Endurox.Client.Machine(*)
Endurox.Client.Name(*)
Endurox.Client.State(*)
Endurox.Domain.ID
Endurox.Domain.Queues
Endurox.Domain.Servers
Endurox.Domain.Services
Endurox.Domain.State
Endurox.Machine.Accessers(*)
Endurox.Machine.Clients(*)
Endurox.Machine.Conversations(*)
Endurox.Machine.State(*)
Endurox.Queue.Machine(*)
Endurox.Queue.RequestsCurrent(*)
Endurox.Queue.State(*)
Endurox.ServerInstance.CommandLine(*)
Endurox.ServerInstance.Generation(*)
Endurox.ServerInstance.Machine(*)
Endurox.ServerInstance.Name(*)
Endurox.ServerInstance.PID(*)
Endurox.ServerInstance.State(*)
Endurox.Service.State(*)
Endurox.ServiceGroup.CompletedRequests(*)
Endurox.ServiceGroup.FailedRequests(*)
Endurox.ServiceGroup.LastExecutionTime(*)
Endurox.ServiceGroup.MaxExecutionTime(*)
Endurox.ServiceGroup.MinExecutionTime(*)
Endurox.ServiceGroup.State(*)
Endurox.ServiceGroup.SuccessfulRequests(*)
To return the values from particular table, use following command:
$ nxget -T <agent ip> <table name e.g. Endurox.Clients>
In NetXMS it is possible import and monitor list of the resources. That can be done in the following way:
Firstly in Configure Data Collection Items (DCI) for new item. For example:
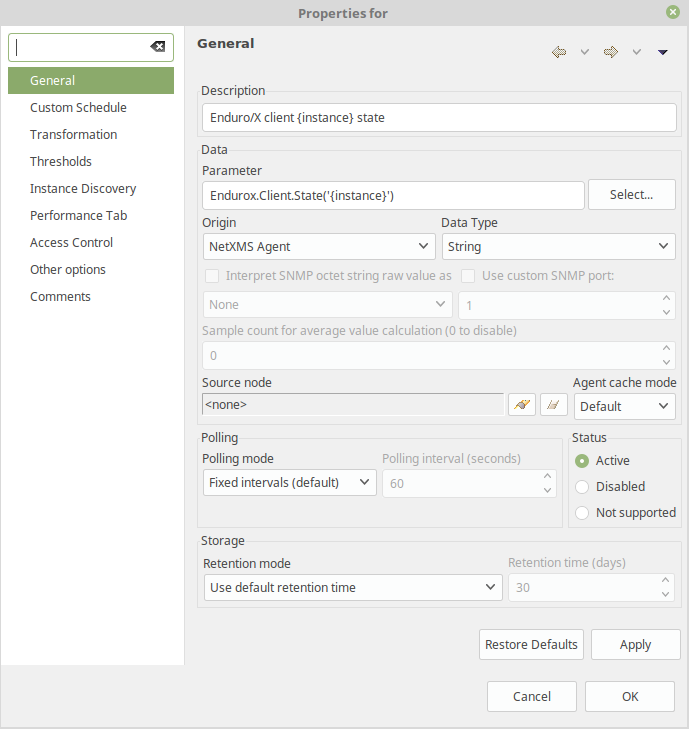
NOTE: As Enduro/X uses comma in identifiers, then in templates quotes must be
- Endurox.Queue
- Endurox.Clients
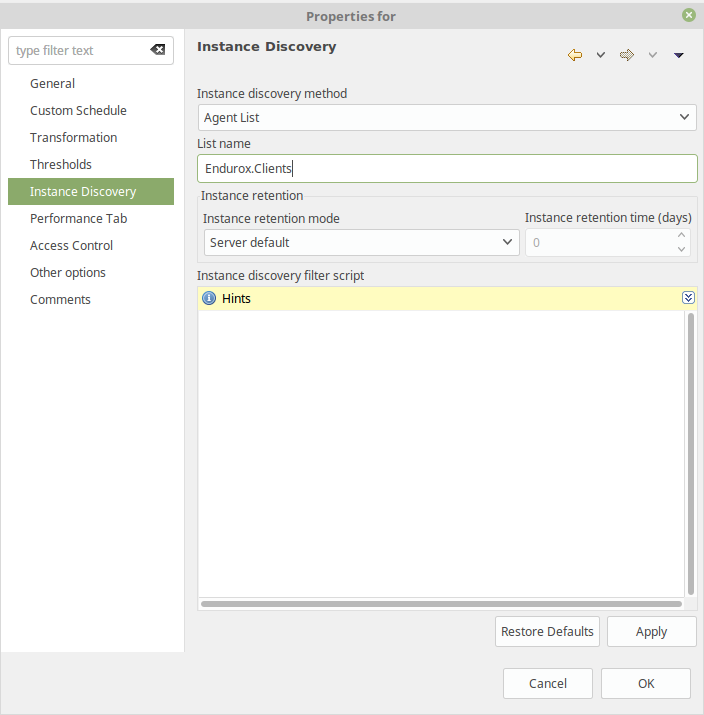
Next configure agent list from which to discover the items:
Once this is configured, instances shall be discovered. On monitored node in NetXMS Console, press left mouse button > Poll > Instance discovery
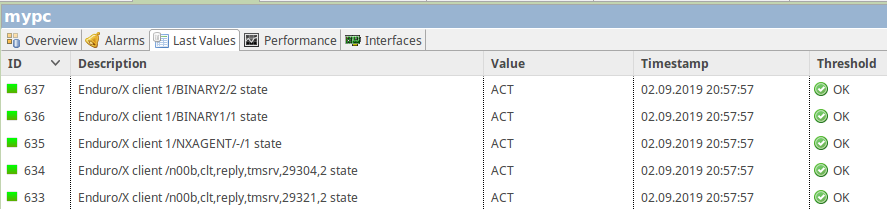
After running the instance discovery, following output may be received:
[02.09.2019 20:57:57] **** Poll request sent to server ****
[02.09.2019 20:57:57] Poll request accepted
[02.09.2019 20:57:57] Starting instance discovery poll for node mypc
[02.09.2019 20:57:57] Running DCI instance discovery
[02.09.2019 20:57:57]    Updating instances for FileSystem.UsedPerc({instance}) [548]
[02.09.2019 20:57:57]    Updating instances for FileSystem.FreePerc({instance}) [552]
[02.09.2019 20:57:57]    Updating instances for Endurox.Client.State('{instance}') [627]
[02.09.2019 20:57:57]       Creating new DCO for instance "/n00b,clt,reply,tmsrv,29321,2"
[02.09.2019 20:57:57]       Creating new DCO for instance "/n00b,clt,reply,tmsrv,29304,2"
[02.09.2019 20:57:57]       Creating new DCO for instance "1/NXAGENT/-/1"
[02.09.2019 20:57:57]       Creating new DCO for instance "1/BINARY1/1"
[02.09.2019 20:57:57]       Creating new DCO for instance "1/BINARY2/2"
[02.09.2019 20:57:57] **** Poll completed successfully ****
In the results in latest values new instances can be seen. In particular case status of clients are monitored:
This chapter will give some recipes how to efficiently configure the NetXMS monitoring system, to show following items on the dashboard:
- Show the single client process status (dead or running).
- Show the status for the group of processes or services (get the number of running instances) and show the last response times in the group of services.
- Show the total number of processed messages for some services and calculate the TPS. Also calculate the total failed messages.
The solution is based on NetXMS 3.1 version (2019), where status indicator is only available for Nodes and business services. This tutorial will use business services for status indicators. Data for monitoring can be gathered in two ways, one is by using DCI (GetDCIValues() (with last 60 seconds visibility to not to see removed DCIs) and other is by direct parameter readings (AgentReadTable() and AgentReadParameter()).
This tutorial will use AgentRead functions.
For XATMI status monitoring, script will be created which will check the presence for particular parameter and check that value matches ACT constant. If it matches, then script returns value 1, if it does not matches or parameter is not present, then script returns value 0.
Further this script can be used for building business service or for building new DCI, to get numeric value for client process status. This assumes that $node variable is available (i.e. script will be executed for some node/server monitored).
//Convert Enduro/X parameter state to number
//@param parameter is parameter name like "EnduroX.Client.State('2/TXUPLD/RUN7/1')"
// which is being monitored
//@return 0 - parameter not found or not ACT, 1 - Parameter found and is ACT
sub NdrxState2Num(parameter)
{
   v = AgentReadParameter($node, parameter);

    if (null==v)
    {
        return 0;
    }

    if (v=="ACT")
    {
        return 1;
    }

    return 0;
}


//If called from DCI...
//return NdrxState2Num($1);
To register script, it NetXMS Management Console, go to Configuration > Script Library and in the window press left mouse button "New…" to create a new script. The name may be the same NdrxState2Num. Copy the contents there in the window and save.
To call the NdrxState2Num() from DCI, create a wrapper script like this and save with name NdrxState2NumDci under the Script Library.
use NdrxState2Num;

//Wrapper for DCI
return NdrxState2Num($1);
To have status monitor indicators, next step is to create a business service. For example we want to monitor following 7 processes (IDs for clients, get by $ nxget -T 127.0.0.1 Endurox.Clients or $ xadmin mibget -c T_CLIENT):
- 2/TXUPLD/RUN1/1
- 2/TXUPLD/RUN2/1
- 2/TXUPLD/RUN3/1
- 2/TXUPLD/RUN4/1
To do this, in left menu under the "Business Services", new "Business Service" needs to be created under which "Node link" must be added only then "Service check…" shall be added. In other combination it wont work, and you will see question marks in the icon tree of NetXMS console.
To use NdrxState2Num() script for process checking in business service, following script can be used:
//Use script library
use NdrxState2Num;

if (0==NdrxState2Num("EnduroX.Client.State('2/TXUPLD/RUN1/1')"))
{
        return FAIL;
}

return OK;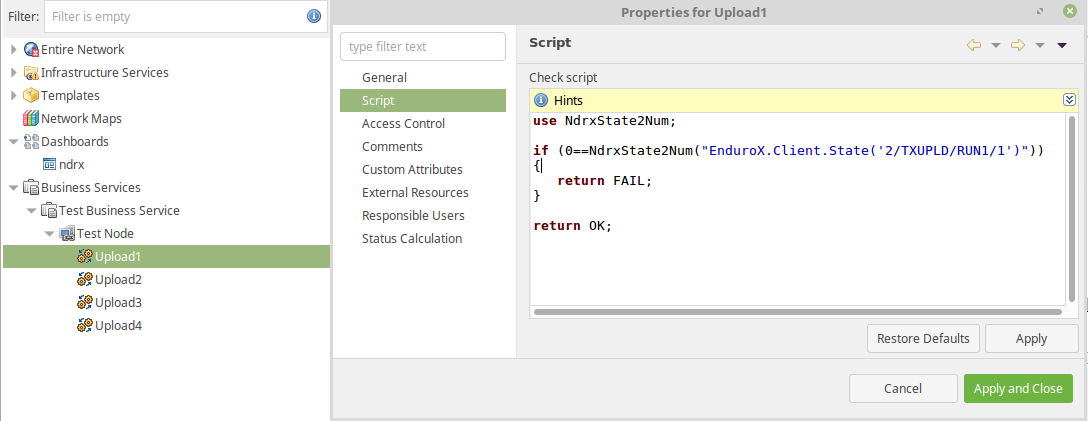
To get the number of service providers (XATMI servers advertising the service) and other aggregated data, analysis will be done on Agent tables, for example "Endurox.ServiceGroups".
Script function will be created which provides following aggregation options:
- min - return min value found for the group;
- max - return max value found in the group;
- avg - return average value of all matched items;
- sum - sum of the matched items.
- cnt - count of the items matched.
Function shall accept the following arguments:
- Table name;
- Key column name;
- Key value name;
- Aggregation column name;
So firstly to see the columns available for data analysis, you may use the following script (execute server script on the Node, i.e. Shift+Alt+S):
t = AgentReadTable($node, "Endurox.ServiceGroups");

if (null==t)
{
    return "Table is not found? Is Agent configured for Enduro/X?";
}

for (c : t->columns) {
    print(c->name . " | ");
}

println("");

for (row : t->rows) {
    for(cell : row->values) {
        print(cell . " | ");
    }

        println("");
}
Sample output could be:
*** FINISHED ***

Result: (null)

SVCNAME | SRVGROUP | LMID | GROUPNO | RQADDR | STATE | RT_NAME | LOAD | PRIO | COMPLETED | QUEUED | SUCCESSFUL | FAILED | EXECTIME_LAST | EXECTIME_MAX | EXECTIME_MIN |
@CCONF | 2/1 | 2 | 0 |  | ACT |  | 0 | 0 | 0 | 0 | 0 | 0 | 0 | 0 | 0 |
@CCONF | 2/2 | 2 | 0 |  | ACT |  | 0 | 0 | 0 | 0 | 0 | 0 | 0 | 0 | 0 |
.TMIB | 2/10 | 2 | 0 |  | ACT |  | 0 | 0 | 1094 | 0 | 1094 | 0 | 0 | 4000 | 0 |
.TMIB-2-10 | 2/10 | 2 | 0 |  | ACT |  | 0 | 0 | 9 | 0 | 9 | 0 | 0 | 0 | 0 |
.TMIB | 2/11 | 2 | 0 |  | ACT |  | 0 | 0 | 31 | 0 | 31 | 0 | 0 | 2000 | 0 |
.TMIB-2-11 | 2/11 | 2 | 0 |  | ACT |  | 0 | 0 | 5 | 0 | 5 | 0 | 0 | 0 | 0 |
DEBIT | 2/80 | 2 | 0 |  | ACT |  | 0 | 0 | 83649 | 0 | 83649 | 0 | 29000 | 35000 | 0 |
DEBIT | 2/81 | 2 | 0 |  | ACT |  | 0 | 0 | 83629 | 0 | 83629 | 0 | 24000 | 32000 | 0 |
CREDIT | 2/140 | 2 | 0 |  | ACT |  | 0 | 0 | 163463 | 0 | 163463 | 0 | 0 | 6000 | 0 |
CREDIT | 2/141 | 2 | 0 |  | ACT |  | 0 | 0 | 3788 | 0 | 3788 | 0 | 0 | 4000 | 0 |
CREDIT | 2/142 | 2 | 0 |  | ACT |  | 0 | 0 | 27 | 0 | 27 | 0 | 0 | 1000 | 0 |
HANDLER | 2/240 | 2 | 0 |  | ACT |  | 0 | 0 | 55878 | 0 | 55878 | 0 | 36000 | 56000 | 0 |
HANDLER | 2/241 | 2 | 0 |  | ACT |  | 0 | 0 | 55647 | 0 | 55647 | 0 | 29000 | 58000 | 0 |
HANDLER | 2/242 | 2 | 0 |  | ACT |  | 0 | 0 | 55753 | 0 | 55753 | 0 | 32000 | 57000 | 0 |
@CPMSVC | 2/9999 | 2 | 0 |  | ACT |  | 0 | 0 | 1 | 0 | 1 | 0 | 0 | 0 | 0 |
Thus following script function, can be written to get the count of the services advertised:
//Match the table entry, get the count
//@param tableName e.g. "Endurox.ServiceGroups"
//@param keyColName to on which perform testings, to count on, .e.g "SVCNAME"
//@param keyExpr regular expression to match given name, e.g. "^@CCONF$"
//@param aggrFunc aggregation function name - min, max, sum, avg, cnt
//@param aggrCol aggregation column used for min, max, sum and avg.
//@return aggregated value
sub NdrxGet(tableName, keyColName, keyExpr, aggrFunc, aggrCol)
{
    ret = 0;
    t = AgentReadTable($node, tableName);

    if (null==t)
    {
        return null;
    }

    key_col = -1;
    agg_col = -1;

    for(i = 0; i < t->columnCount; i++)
    {
        if (t->getColumnName(i) == keyColName)
        {
                chk_col=i;
        }
        else if (t->getColumnName(i) == aggrCol)
        {
            agg_col=i;
        }

    }

    //No column found..
    if (-1==chk_col)
    {
        print("ERROR! Key column not found: ".keyColName."\n");
        return null;
    }

    if (-1==agg_col && (aggrFunc=="min" || aggrFunc=="max" || aggrFunc=="sum" || aggrFunc=="avg"))
    {
        print("ERROR! Aggregation column not found: ".aggrCol."\n");
        return null;
    }

    match_rows = 0;
    // Process the data...
    for(i = 0; i < t->rowCount; i++)
    {
        keycolvalue = t->get(i, chk_col);

        if (keycolvalue ~= keyExpr)
        {
            match_rows++;

            if (aggrFunc=="cnt")
            {
                ret++;
            }
            else
            {
                data = t->get(i, agg_col);

                //print("AGG: ".data."\n");

                if (aggrFunc=="sum" || aggrFunc=="avg")
                {
                    ret+=data;
                }
                else if (aggrFunc=="min")
                {
                    if (1==match_rows)
                    {
                        ret = data;
                    }
                    else if( data < ret )
                    {
                            ret = data;
                    }
                }
                else if (aggrFunc=="max")
                {
                    if (1==match_rows)
                    {
                        ret = data;
                    }
                    else if( data > ret )
                    {
                        ret = data;
                    }
                }

                first=0;
            }
        }
    }

    if (0==match_rows && (aggrFunc=="min" || aggrFunc=="max" || aggrFunc=="sum" || aggrFunc=="avg"))
    {
        ret = null;
    }
    else if (aggrFunc=="avg")
    {
        ret = ret/match_rows;
    }

    return ret;
}

//To test:
//return NdrxGet("Endurox.ServiceGroups", "SVCNAME", "^DEBIT$", "sum", "COMPLETED");
//return NdrxGet("Endurox.ServiceGroups", "SVCNAME", "^DEBIT$", "avg", "COMPLETED");
//return NdrxGet("Endurox.ServiceGroups", "SVCNAME", ".TMIB", "min", "COMPLETED");
//return NdrxGet("Endurox.ServiceGroups", "SVCNAME", ".TMIB", "max", "COMPLETED");
//return NdrxGet("Endurox.ServiceGroups", "SVCNAME", ".TMIB", "avg", "COMPLETED");

//To start the script from DCI, we need to actually call it:
//return NdrxGet($1, $2, $3, $4, $5);
Store the script in library as "NdrxGet".
To run "NdrxGet" from DCI, lets create a wrapper script and save it as NdrxGetDci in script library.
use NdrxGet;

//Call this from DCI, pass the arguments
//as: NdrxGet("Endurox.ServiceGroups","SVCNAME","HANDLER","sum","FAILED")
return NdrxGet($1, $2, $3, $4, $5);
To create Some Data Collection Items based on these script, for hosts, DCI items can be created. Document shows how to create following data collection items.
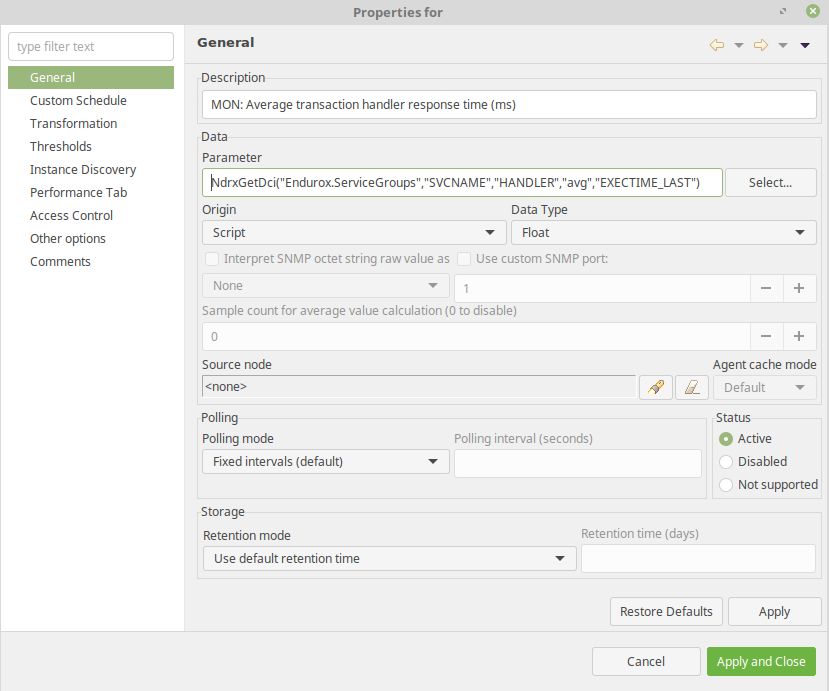
The average response time here is measured for service named "HANDLER".
- DCI Origin: Script;
- Parameter: NdrxGetDci("Endurox.ServiceGroups","SVCNAME","HANDLER","avg","EXECTIME_LAST");
- Data Type: Float
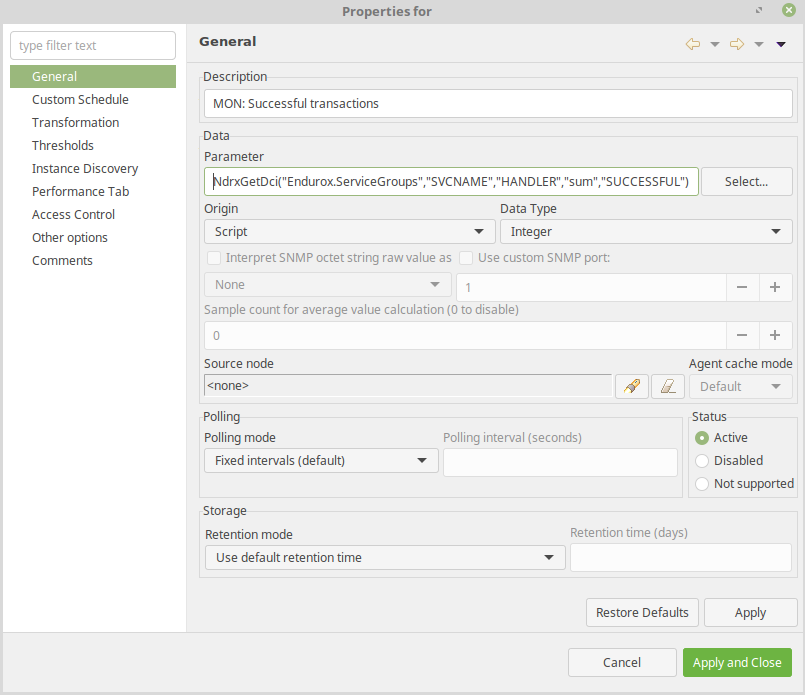
Number of successful messages processed here are measured for "HANDLER" service.
- DCI Origin: Script;
- Parameter: NdrxGetDci("Endurox.ServiceGroups","SVCNAME","HANDLER","sum","SUCCESSFUL")
- Data Type: Integer
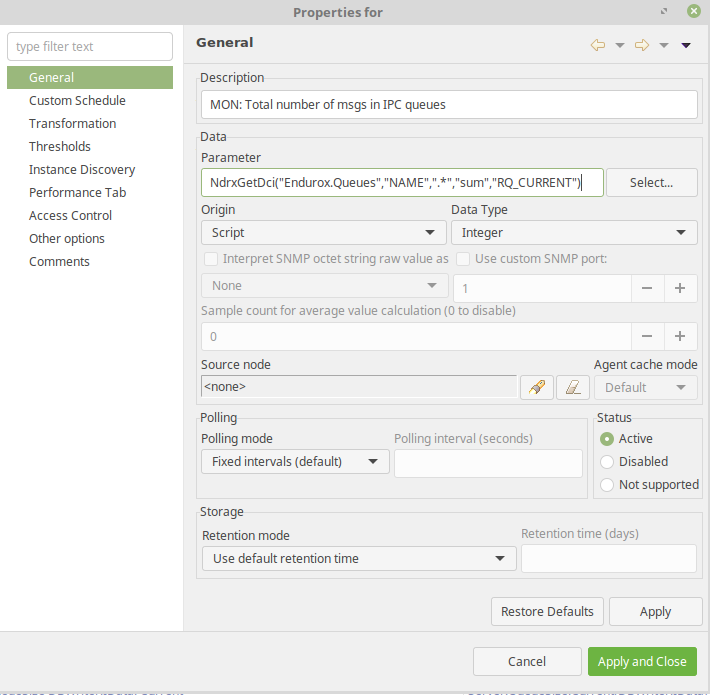
This indicator usually shall be very small like 0..1..2, if it grows higher, then this indicates that system is unable to cope with the workload. This value is recommended to be monitored.
- DCI Origin: Script;
- Parameter: NdrxGetDci("Endurox.Queues","NAME",".*","sum","RQ_CURRENT");
- Data Type: Integer
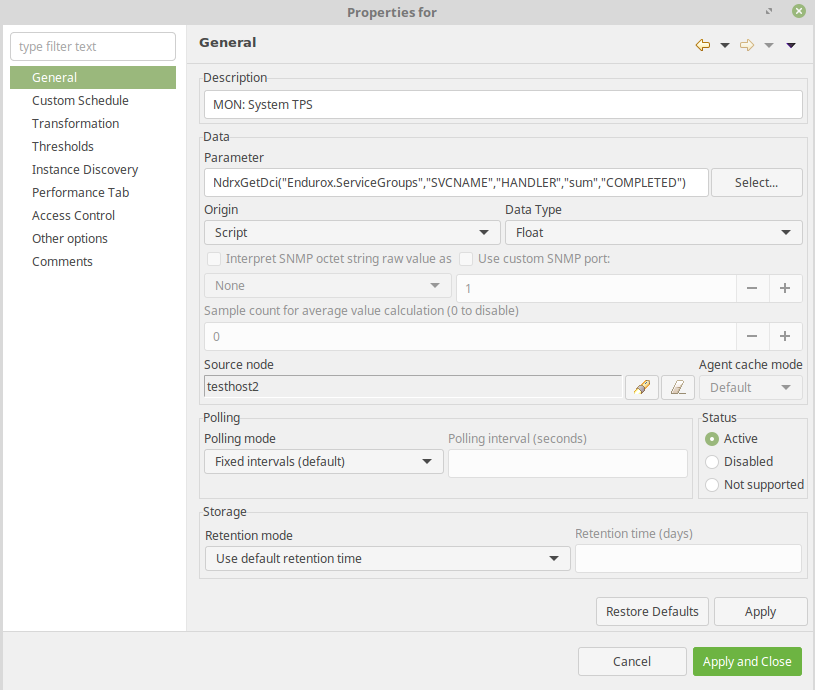
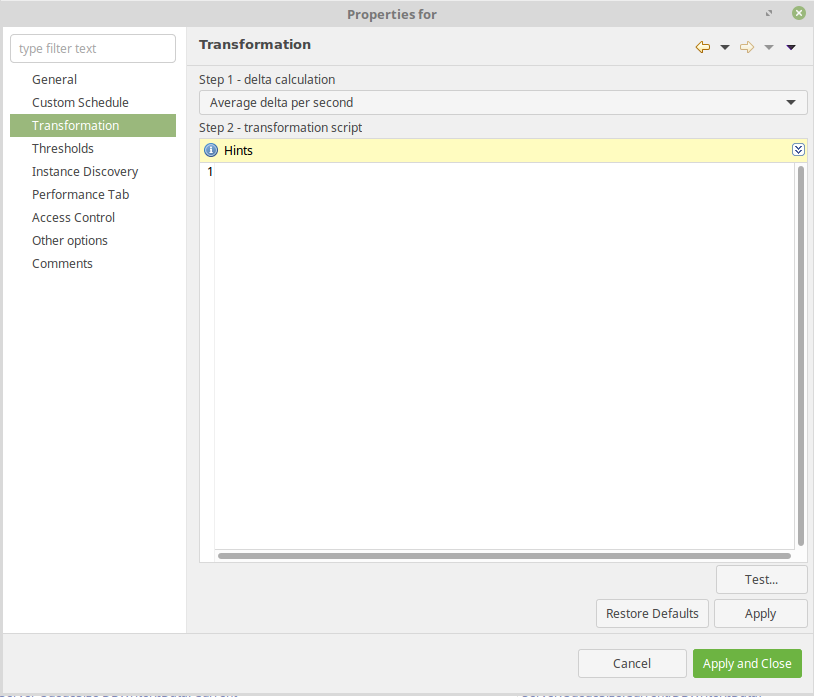
Also it is useful to monitor the number system throughput. This shall be done one some main service which handles all the incoming traffic. In this case service "HANDLER" is monitored.
- DCI Origin: Script;
- Parameter: NdrxGetDci("Endurox.ServiceGroups","SVCNAME","HANDLER","sum","COMPLETED");
- Data Type: Integer
- Transformation: Average delta per second
This section lists the notes regarding to the high availability features available in Enduro/X product.
Enduro/X is cluster-aware and scalable across several instances. Out of the box Enduro/X provides the following cluster-aware functions:
- tpbridge(8) process ensures that XATMI services are shared across the connected machines (nodes).
- XATMI clients can call the services across the cluster (directly connect nodes) and load balancing may be configured to split the network service and local service usage. In case local services become unavailable, the network services are chosen to fulfill the request. In case local services are not available, the call will go to network services.
- Enduro/X smart cache can replicate cache records across the linked machines. With limitation, that if the link is lost between machines, the cache records might fork, as currently no mechanisms are provided to synchronize caches while the link is restored.
- Process groups, which can be configured in singleton mode (basically failover mode), thus it is possible to configure that set of processes (XATMI clients and servers) in a cluster of several machines run only on one machine at a time, meanwhile, if the active machine goes out of order, then failover happens available machine.
- In case of failover distributed transaction manager tmsrv(8) can be configured to automatically recover transaction logs written by another node. However, transaction logs must be placed on the shared file system.
- In case of failover, transactional queue tmqueue(8) can be configured to automatically load messages from the disk processed by another node. However, the message store must be placed on the shared file system.
Singleton process groups are available from Enduro/X version 8.0.10.
The full life-cycle of the transaction is managed by a particular transaction manager tmsrv(8) instance which starts the particular distributed transaction. tmsrv instance instance is identified by Enduro/X cluster node id and <srvid> tag from ndrxconfig.xml(5).
In case if high-availability is required for the distributed transaction environment, the failover functionality may be configured for the tmsrv. So that, if the node had active transaction managers, but for some reason node becomes unavailable, the other Enduro/X node may take over the transactions started on the crashed node.
By design, distributed transaction manager tmsrv(8) uses file system storage, to strong the transaction logs. First step of the configuring failover, the transaction manager shall store its logs on the shared file system, for example, IBM Spectrum Scale GPFS or GFS2 or any other FS which has Posix semantics. Logs directory for tmsrv is set by -l parameter.
The second step for implementing failover for transaction managers is to configure the singleton groups for tmsrv(8) instances. Additionally instances of the different Enduro/X nodes shall point to the same transaction log directory on shared fs. As transaction logs include information about the Enduro/X cluster node id and <srvrid> values on which the transaction was started, it is crucial that tmsrv(8) on different Enduro/X nodes match following attributes:
- Common virtual Enduro/X cluster node id shall be set for matching tmsrv(8) instances. The value shall be passed to the tmsrv parameter -n. Which shall be set to any node number from the cluster.
- Transaction manager instances in different Enduro/X nodes must match <srvid> tag from ndrxconfig.xml(5).
After the transaction manager process definition in the singleton process group, tmrecoversv(8) shall be configured. This ensures that any orphaned prepared transactions branches are collected (rolled back). For failover groups, it is recommended to use -i (immediate) flag, so that tmrecoversv run is done without a delay. Orphans may happen if Enduro/X cluster node crashes during the prepare phase of the distributed transaction, as at that time for performance reasons, fsync() on transaction log file storage is not used.
In case if using tmsrv for tmqueue(8) group, the tmrecoversv shall be put right after the tmqueue process definition in ndrxconfig.xml(5), instead of the tmsrv.
Another instance of tmrecoversv shall be configured at the end of the whole application for each Enduro/X node. Such tmrecoversv shall run periodically. That will allow of housekeeping any orphaned prepared transactions for whom corrupted transaction logs were left on the disk after the failover.
Additionally, during the failover, the active-state (not yet prepared according to 2PC) transaction branches may not be controlled by the tmsrv which took over the operation, as tmsrv for performance reason such info logs to disk with fflush() Unix call, which means that on a node that took over, the transaction data might not be available, and active transactions in resource manages cannot be rolled back by Enduro/X tools. However developer may use exec_on_bootlocked or exec_on_locked user exit points and develop scripts for collecting activate transactions from the resource managers. Additional details for working with specific resource managers are outside of the scope of this guide.
tmsrv(8) shall be configured to use FSYNC (or FDATASYNC) and DSYNC flags in the NDRX_XA_FLAGS env, so that the commit decision is fully logged to the storage device.
WARNING! To use failover functionality for the distributed transactions, the underlying hardware and software infrastructure shall provide certain capabilities. which are described in the following chapter.
When the transaction is about to commit, tmsrv(8) writes the decision to the persistent storage. For transaction consistency, it is crucial that no write happens from the failed node to the shared storage after the failover. If such writes happen, transaction logs might become corrupted and Enduro/X transaction manager may lose transactions.
For transactional message tmqueue, it is mandatory that no writes happen to the shared file system (including file rename and unlink), open new handles, write from the failed node to the shared storage after the failover.
Before the failed node is repaired (automatically or manually) and shared fs becomes mounted back in read/write mode, the Enduro/X application must be killed (at minimum all tmsrv and tmqueue processes which were using a particular shared file system).
Example cases, where write to disk from failed node might happen:
- Virtual machine with currently active node is paused, shared file system assumes that the node has failed and left the cluster, the shared file system cluster gives fcntl() lock (used by singleton groups) to failover node which takes over. After the takeover, the paused node is resumed. In such cases, there might be possible shared file system corruption or transaction corruption, as concurrent writes to transaction logs are not supported by Enduro/X transaction manager.
- Active node is so busy with work and becomes unresponsive (basically server overloaded), so that the shared file system cluster may decide that node failed (unresponsive), and it does the failover (release locks/give locks to another node). When the failed node load is back to normal, it starts to write to disk again, which may corrupt the data.
To resolve such scenarios, hardware-level fencing is required. In an ideal scenario, STONITH shall be employed, so that if a node fails, it is restarted and only then shared file system give fcntl() lock to the failover node. GFS2 is using this mechanism. STONITH is recommended way to the fence, as that would also ensure that user application processes are terminated immediately and not duplicate runs in the cluster would be possible.
GPFS on the other hand, does not use STONITH, however, it offers two mechanisms, to fence such invalid writes:
- Time-based leasing. At the driver level GPFS detects that failover has happened, and time leas has expired, then no writes to disk happen. However, this is not always reliable, as, if VM is paused, and then resumed the time during the pause/resume cycle by some VM hypervisors, time does not move forward during the pause, resulting in the time lease not expired on the failed node, but assumed to be expired by other nodes. This might cause corruption of the shared file system, as the failed node at resume writes immediately to the disk, which corrupts structures processed by other nodes. This might lead to GPFS partition being unmounted to all cluster nodes, and mmfsck on the partition might be required to mount the partition back. Additionally, after the mmfsck, some files might be lost/corrupted. The second problem here is, if such writes continue, that might cause Enduro/X transaction log corruption. If still deciding to use time-based fencing, then risks shall be considered, to what extend such pause/resume or server overload (or another such similar kind of errors) actually can happen in the given environment.
- Another option which is supported by IBM GPFS, is to have IO fencing, such as Persistent Reserve (SCSI-3 protocol), In this case, at the hardware level shared disk is disconnected from the failed node. This is the recommended way to fence the failed node, as it ensures that no writes to the shared file system. However, additional configuration is required, that during the partition unmount at the failure by the GPFS all the Enduro/X application processes are killed. This is needed to protect the transaction logs by concurrent writes, after the GPFS remounts the shared file system, when it re-initializes Persistent Reservation and mounts the disk back. Please consult with IBM, about which hardware is supported by the GPFS for SCSI-3 Persistent Reservation fencing. An additional benefit from this fencing mechanism is that cluster node loss detected is faster than using time leases.
The following key Posix file system properties must be met by the shared file system, to have the transaction and persistent queue consistency after the crash:
- fsync() or fdataync() Unix calls after the successful return guarantees that data is written to the file, even after the system crash.
- When a new file is created, and the program did Unix call fsync() on the file descriptor there must be guarantees, that file appears in the directory after the fsync() returns successful results. For Linux "DSYNC" Enduro/X flag can be set which opens the directory in read-only mode and performs fsync() on the directory file descriptor.
- When the program issues rename() Unix call on the file, the operation is atomic and the new path is persisted on disk after rename() successfully returns. For Linux "DSYNC" Enduro/X flag ensures that Linux synchronises the directory to the final state.
- When the program issues unlink() Unix call to the file, the operation must be atomic and persisted to the disk after unlink() successfully returns. For Linux "DSYNC" Enduro/X flag ensures that Linux synchronizes the directory to the final state.
If the above features are not provided by the Operating System or Shared File System, at the point of crash and failover, there might be a chance for a transaction loss.
To ensure, that Enduro/X application is killed on the shared fs failure, GPFS callback script shall be configured. Local event unmount is recommended for this purpose, and can be configured in the following way:
Firstly let’s create the script which will be called on the event. The script invokes the Enduro/X xadmin "killall" command which matches the "$ps -ef" pattern in grep style, extracts PIDs, and kills them with -15, -9 signals with additional ndrxd killing first, to avoid respawning, this is done from the root user. The "xadmin killall" is quicker, but it might note remove all processes, thus after that from the application user and application environment, the xadmin down is called to ensure that all processes and shared resources from the application are removed. Note that if disk failure happens, the application on the broken node is terminated, and shall be booted back manually. It might be possible to use mount callback, to start the application back, however, that’s outside of the scope of this document, and at such a crash as FS loss, server reboot would be recommended, whereas at startup server boot scripts would start the application back.
Forced termination script:
$ su - root

# mkdir /opt/app

-- 1) In the following command replace "user1" with application user.
-- 2) Replace "/home/user1/test/conf/settest1" with environment file of the application.

# cat << EOF > /opt/app/app_cleanup.sh
#!/bin/bash

#
# pre-mount script, after the crash ensure that
# no processes from "user1" are working
# add to GPFS by mmaddcallback app_cleanup --command=/opt/app/app_cleanup.sh --event unmount --sync
#
xadmin killall ndrxd user1
su - user1 -c "source /home/user1/test/conf/settest1; xadmin down -y"
exit 0

EOF

# chmod +x /opt/app/app_cleanup.sh
When the script is, ready it must be copied to all the nodes in the cluster. After that, the callback can be enabled by:
$ su - root
# mmaddcallback app_cleanup --command=/opt/app/app_cleanup.sh --event unmount --sync
To enable Persistent Reservation for the GPFS, use the following command:
$ su - root
# mmchconfig usePersistentReserve=yes
To check the status of the Persistent Reservation enabled:
$ su - root

# mmlsnsd -X

 Disk name       NSD volume ID      Device          Devtype  Node name or Class       Remarks
\-------------------------------------------------------------------------------------------------------
 nsd1            C0A8126F652700FD   /dev/sdb        generic  g7node1                  server node,pr=yes
 nsd1            C0A8126F652700FD   /dev/sdb        generic  g7node2                  server node,pr=yes
 nsd1            C0A8126F652700FD   /dev/sdb        generic  g7node3                  server node,pr=yes
pr=yes, means that the persistent reservation feature is enabled.
While technically it is possible to configure GFS2 an GPFS to use two server node clusters, for simplicity of administration and better fault tolerance, three node clusters are recommended. All nodes shall have access to the shared disk storage.
As for the Enduro/X application itself, it may run on two nodes, and the third node maybe used as a quorum node only for the shared file-system infrastructure.
The shared file-system configuration instructions are out of the scope of this document.
The typical topology of the Enduro/X cluster would look like the following:
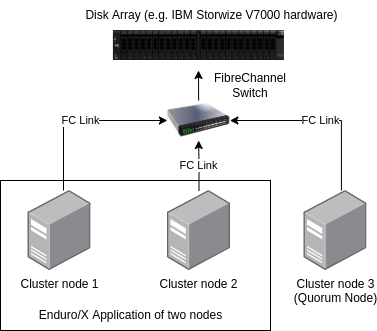
AFor the disk connectivity, the shared disk array may be connected via FibreChannel (FC) or iSCSI. FibreChannel method is the preferred way of connecting disks. For Fibre Channel, link speeds typically would be 16 Gbps or 32 Gbps. For iSCSI link speed typically is 10G or 25G.
For the performance requirements, disk models, disk array, configuration guides and what is supported with the chosen shared file system, please consult with the corresponding Software and Hardware vendors.
NOTE: For IBM Spectrum Scale GPFS, hardware level Persistent Reserve (SCSI-3 protocol) fence support, consult with IBM on which devices on GPFS support the given feature.
When choosing the hardware for transaction manager (tmsrv) and transactional message queue support (tmqueue), the key performance aspect of the hardware, is the number of fsync() operations per second disk infrastructure is capable of. fsync() is a command that issues write to disk and returns only when data is actually persisted on the disk (i.e. avoids the "cached only" state).
Please ask the enterprise disk vendors, which models they recommend for fast fsync() operations (i.e. number of fsync() per second, as pure random write IOPS not always correlated with the fsync() numbers). For example Samsung 980 Pro according to specs, has about 500K random write IOPS and Intel S4600 SSDs have 72K random write IOPS, however in tests with fsync(), Intel S4600 is about 10x faster than Samsung counterpart. Probably it is related to the fact that Intel S4600 is an enterprise SSD, and might contain some capacitor-backed cache with the drive. In classic RAID setups, it has been also shown that Enterprise level battery-backed RAID controllers have better fsync() performance, than drives without battery backup. The disks selection in case if no clear information is available from vendors, may be chosen on an empirical base, by doing benchmarks on different configurations.
Typically Enduro/X has the following fsync numbers:
- 2x fsync() per tmsrv transaction completion.
- 3x fsync() operations per tmqueue operation (per msg enqueue or dequeue), not counting fsync related to tmsrv.
However, fsync() is not the only parameter which affects the application performance.
tmqueue(8) server uses file-system-based storage for storing persistent messages. For cluster-oriented operations, failover is supported, but in that case directory that holds the messages shall be stored on the shared file system, for example, GFS2 or GPFS.
The directory for tmqueue(8) is configured in the XA open string for libndrxxaqdisks(8). Failover for tmqueue can be enabled by configuring it in the singleton process group, as described in the next chapter.
As message files stored on this disk encode the original Enduro/X server ID and Enduro/X cluster node ID, for failover mode, all cluster nodes which provides backup locations for the given queue space, shall configure the following attributes:
- Common/virtual Enduro/X cluster node id shall be set for matching tmqueue(8) instances. The value shall be passed to the tmsrv parameter -n. Which shall be set to any node number from the cluster, however, for all instances, it must be the same.
- Queue space server instance in different Enduro/X nodes must match <srvid> tag from ndrxconfig.xml(5).
If the requirement for the application is to have only one copy of the binary in the server cluster, then singleton process groups can be used for this purpose. Each singleton group requires a lock provider exsinglesv(8) process instance, which, by acquiring the lock, distinguishes on which machine the singleton group is started. exsinglesv(8) currently works with fcntl(2) Unix locks, meaning that cluster file system shall provide such functionality (e.g. GFS2 or GPFS) and it must be configured for the Enduro/X nodes to support singleton process groups.
In the event of node failover, the next available node will acquire the lock and after a certain time delay singleton group will be started on the new node. Meanwhile, if old node is still active but lost the lock for some technical reason (such as shared file system becomes unavailable, or exsinglesv was shutdown), the processes in groups are killed with signal 9.
The processes in groups (as well as all processes in Enduro/X) are controlled by either ndrxd(8) or cpmsrv(8), thus group activation and deactivation (kill -9, if the lock was lost) are performed by theses binaries within the sanity check intervals, thus reasonable short sanity cycles shall be set for the processes (tag <sanity> in ndrxconfig.xml(5) for ndrxd and -i flag for cpmsrv). Reasonably these should be set to 1 or 2 seconds, however, depending on the process count configuration, that might increase the system load spent on checks.
The singleton process group boot order by default is the same as for the normal startup. In case if failover happens, the exsinglesv got the lock, did failover wait and after reporting locked status to shared memory, at the next ndrxd sanity cycle, will boot all the XATMI server processes in the original boot sequence. When all servers in the group are started, cpmsrv will continue with the boot of the client processes.
By setting attribute noorder="Y" in <procgroup>, the boot order is ignored, and all server processes in the group are started in parallel. The cpmsrv will not wait for the process group servers to boot but will proceed immediately.
The maximum number of processes in the process group is limited by the NDRX_MSGMAX setting from the ex_env(5). The default is limit 64. The hard limit is 99999.
Singleton process groups do not ensure a 100% probability that processes will run in one copy only at the same time on any Enduro/X node instance. There could be cases, such as VM pauses and resumes when the current node was removed from the shard FS cluster fcntl lock is removed, the other node gets the shared file system lock and the group is booted on the new node. Meanwhile, for some reason VM on the old node was resumed from pause, the old node exsinglesv/ndrxd/cpmsrv will detect that the group lock was lost and group processes will be killed, but this detection requires run of full exsinglesv check cycle (and shared FS shall not freeze the access) and over that and additional two sanity cycles of ndrxd/cpmsrv are required. Meaning that during this time singleton processes will run on two nodes at the same time. To ensure that this never happens, the STONITH device must be configured. For example GFS2 requires STONITH as part of the shared file system installation. For other shared file system clusters, please consult with the corresponding vendor. However, if STONITH is not available on the given shared file system, Enduro/X transaction manager still can keep the distributed transaction consistency, with the requirement, that in the event of shared fs cluster failure, fs becomes unavailable or read-only.
Singleton groups keeps the following health-checks:
- Each group in shared memory keeps the refresh time-stamp interval. the exsinglesv periodically refreshes the time-stamp in shared memory (monotonic clock-based time-stamp). If processes such as ndrxd and cpmsrv detect at sanity cycles that time-stamp refresh has not happened in the configured time (NDRX_SGREFRESH from ex_env(5)), the group in shared memory is unlocked, and ndrxd/cpmsrv proceeds with killing all the group processes.
- exsinglesv regularly verifies the lock status. Checks include requests to other nodes via tpbridge(8) if exsingleckl(8) and exsingleckr(8) services are configured. If these services are not used, then checks are done against ping/heartbeat file (to detect the highest lock counter of all involved nodes). If the locked node detects that other nodes have higher counter value, then the given node performs group unlock and after that ndrxd and cpmsrv step in to kill the group processes.
- In case STONITH is not used tmsrv(8) after each commit decision logged, verifies that it is still the locked node. Verification is done against, shared memory entry of the singleton group, additionally tmsrv checks the status against the heartbeat file or performs heartbeat status reading from other nodes. If using STONITH device, this check optionally can be disabled, by setting ndrxconfig.xml(5) setting sg_nodes_verify to N. For each transaction, 3x checks are made. At start of the transaction, before committing decision logging and right after the decision is successfully logged. For TMQ transactions, additional checks are made when when TMQ transaction is started and at the point where it is being prepared.
- To support failure recovery, tmsrv and tmqueue processes have been updated new CLI setting -X<seconds>. This setting is used to detect parallel run of the tmsrv and tmqueue processes, to recover from cases when parallel instances have generated queue messages or transactions. tmsrv will load un-seen transaction logs on the fly, however, tmqueue will reboot in case new messages appear in Q-space disk so that queue-space on active node can be consistently read messages from the disk. -X setting for tmsrv also lets to remove expired/broken transaction logs, which for some scenarios allows tmrecoversv(8) to remove any locked prepared records.
NOTE: when operating with process groups, it is not recommended to store the ndrxd, cpmsrv and exsinglesv process logs on the shared file system, as in case of shared file system failure, the processes may get killed, leading to the fact that singleton groups will not be unlocked locally, and processes from singleton groups would not be removed.
The following diagram depicts the core functionality of the singleton group failover, including distributed transaction and persistent queue processing.
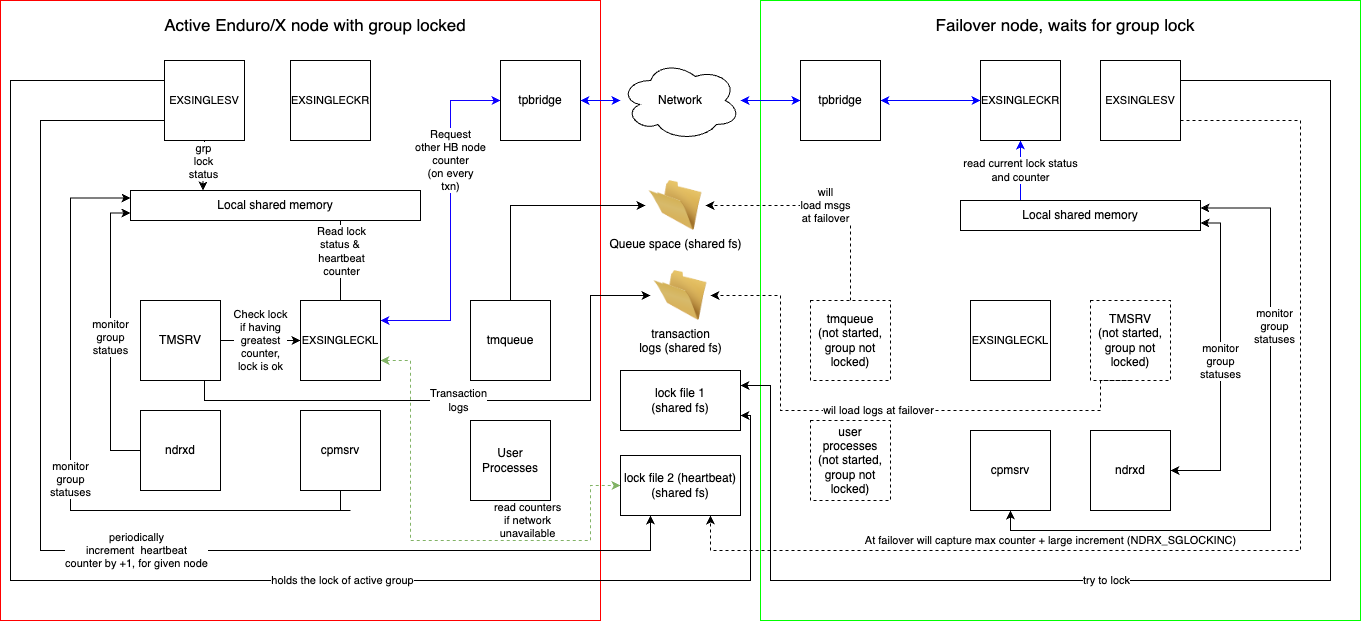
This chapter provides a sample configuration for having a cluster of two machines, and for the matter of keeping instructions short, one singleton process group is configured, which is located on both machines. By default, 64 process may be configured, and they may be configured in the same way as described here.
Process group "RM1TMQ" will be configured in the example, allocated on nodes 1 and 2.
For tmsrv following additional settings shall be used:
Table 5. tmsrv - Recommended additional CLI parameters for failover processing
| Parameter | Description | Recommended value |
|---|---|---|
-n<node_id> | Common cluster node id, used for log file recognition | Any node ID (NDRX_NODEID) used in a cluster. Shall be common for all participants in the cluster |
-X<seconds> | Number of seconds to run for disk checks (i.e. scan for unseen transaction logs or housekeep broken records after their expiry). | 10 |
-h<seconds> | Number of seconds to wait for housekeeping to remove corrupted transaction logs. Corrupted logs might happen if the active node opened the transaction and did not pass till the committing phase. On the new node, some records in the resource (e.g. DB, TMQ) might stuck in the prepare phase, until housekeep happens. | 30 |
-a<nr_tries> | Number of attempts to try to load broken transaction logs. | 3 |
Table 6. tmqueue - Recommended additional CLI parameters for failover processing
| Parameter | Description | Recommended value |
|---|---|---|
-n<node_id> | Common cluster node id, used for log file recognition | Any node ID (NDRX_NODEID) used in a cluster. Shall be common for all participants in the cluster |
-X<seconds> | Number of seconds to run for disk checks (i.e. scan for non-loaded messages, left from another node if had concurrent run). Normally shall not happen if proper fencing is used, however, it is recommended to leave this setting for any failover setup. | 60 |
-t<seconds> | Default timout for automatic/forward transactions. Due to fact that for example, GPFS may freeze the working node, if not-active node leaves the cluster, the transaction timeout shall be set to a reasonable value, so that the transaction is not rolled during the cluster reconfiguation. This generally applies to any global tansactions used in the application. In case of GPFS, during the tests it is shown, that for good node, share fs may freeze for about to 30 sec. | 60 |
Additional notes:
If expecting a large number of messages in the persistent queue (>5K), please increase the process boot time in <server> tag for tmqueue, for example:
        <server name="tmqueue">
            ...
            <start_max>200</start_max>
            <srvstartwait>200</srvstartwait>
        </server>
would allow the boot sequence to wait for the message to load into the memory queue space, before moving on to the next XATMI server to boot. Check the settings in ndrxconfig.xml(5).
Table 7. tpbridge - Recommended additional CLI parameters for failover processing
| Parameter | Description | Recommended value |
|---|---|---|
-z<zero_snd_time> | Interval into which zero-length message is sent to the socket to keep the activity | 5 |
-c<check_time> | Number of seconds for check intervals. This interval checks for running -z message sending | 2 |
-a<rcv_time> | Number of seconds into which something must be received from the socket, if not received, the connection is closed | 10 |
The above configuration will ensure, that socket will be reset after 10 seconds, in case of failed node cut-off, and services will not be available on the survived node.
Table 8. exsinglesv/exsingleckl - Recommended [@exsinglesv/<subsection>] settings
| Parameter | Description | Recommended value |
|---|---|---|
noremote | Disable remote checks, i.e. do not call @SGREM service on other node to check the active node lock status, use only @SGLOC, which would do the node counter checks in heartbeat file | 1 - is recommended for GPFS setups, as file read-only access possibly is faster than network access. Default is 0 - disabled (use @SGREM for remote node status/counter reading |
Defaults (and recommended) values for exsinglesv(8) (with default NDRX_SGREFRESH env value) are:
- Check interval 10 seconds (chkinterval).
- Maximum refresh time, by which the local node will unlock is 30 seconds (NDRX_SGREFRESH). I.e. exsinglesv must have run at least one check cycle at this time.
- Other Enduro/X node singleton process group boot time, after the failover (shared file system has released lockfile_1 to another node) is 6 check cycles (locked_wait). This means that total time for the survived node to boot would depend on the shared file system re-configuring timeouts/settings to release fcntl() locks, plus this wait time (e.g. 6 cycles multiplied by 10 sec of the chkinterval). The wait time shall be at least two times higher than other node refresh times, as that would ensure that if the lock provider lost the lock on the other node for some reason, two times higher value would give time to the other node’s ndrxd/cpmsrv processes to kill the group. And only after that time, the new node would boot the processes back on.
Following ini-based common configuration settings for all cluster nodes which work for the singleton group would be needed:
################################################################################
# Additional debug settings for lock providers. Loggin happens to *tp* topic
################################################################################

[@debug]
...
# lock providers are using "tp" log topic:
exsinglesv=tp=5 file=
exsingleckl=tp=5 file=
exsingleckr=tp=5 file=

################################################################################
# Lock provider log files
# Most of the settings are defaults (thus not listed here)
################################################################################

# settings for singleton group RM1TMQ, note that CCTAG here used is the same
# as the group name, but these are two different identifiers, just used
# with the same name for convenience.
[@exsinglesv/RM1TMQ]
lockfile_1=/path/to/shared/storage/RM1TMQ/lock_1
lockfile_2=/path/to/shared/storage/RM1TMQ/lock_2

################################################################################
# queues for each of the queues spaces
################################################################################
[@queue/RM1TMQ]
Q1=svcnm=QFWD1,autoq=T,tries=3,waitinit=0,waitretry=1,waitretrymax=5,memonly=n,mode=fifo,workers=1
Q2=svcnm=QFWD2,autoq=T,tries=3,waitinit=0,waitretry=1,waitretrymax=5,memonly=n,mode=fifo,workers=1

################################################################################
# XA driver configuration
################################################################################

[@global/RM1TMQ]
NDRX_XA_RES_ID=1
NDRX_XA_OPEN_STR=datadir="/path/to/shared/storage/qsp/SAMPLESPACE",qspace="SAMPLESPACE"
NDRX_XA_CLOSE_STR=${NDRX_XA_OPEN_STR}
NDRX_XA_DRIVERLIB=libndrxxaqdisks.so
NDRX_XA_RMLIB=libndrxxaqdisk.so
NDRX_XA_LAZY_INIT=0ndrxconfig-dom1.xml (for node 1) and ndrxconfig-dom2.xml (for node 2). Configuration file instances mostly are the same for all involved nodes, thus only one template will be prepared in this guide:
<?xml version="1.0" ?>
<endurox>
    <appconfig>
        ...
        <sanity>1</sanity>
        ...
    </appconfig>
    <procgroups>
        <procgroup grpno="5" name="RM1TMQ" singleton="Y" sg_nodes="1,2" sg_nodes_verify="Y"/>
        ...
    </procgroups>
    <defaults>
    ...
    </defaults>
    <servers>
    ...
        <!--
            Start of the group RM1TMQ
        -->
        <server name="exsinglesv">
            <min>1</min>
            <max>1</max>
            <srvid>30</srvid>
            <sysopt>-e ${NDRX_ULOG}/exsinglesv-a.log -r</sysopt>
            <!-- set as lock provider -->
            <procgrp_lp>RM1TMQ</procgrp_lp>
            <cctag>RM1TMQ</cctag>
        </server>
        <!-- support servers, local -->
        <server name="exsingleckl">
            <min>10</min>
            <max>10</max>
            <srvid>40</srvid>
            <sysopt>-e ${NDRX_ULOG}/exsingleckl-a.log -r</sysopt>
            <procgrp_lp>RM1TMQ</procgrp_lp>
            <cctag>RM1TMQ</cctag>
        </server>
        <!-- support servers, remote -->
        <server name="exsingleckr">
            <min>10</min>
            <max>10</max>
            <srvid>50</srvid>
            <sysopt>-e ${NDRX_ULOG}/exsingleckr-a.log -r</sysopt>
            <procgrp_lp>RM1TMQ</procgrp_lp>
            <cctag>RM1TMQ</cctag>
        </server>
        <server name="tmsrv">
            <min>3</min>
            <max>3</max>
            <srvid>60</srvid>
            <cctag>RM1TMQ</cctag>
            <!-- /kvmpool/data/test/tmlogs/rm1 points to shared folder -->
            <sysopt>-e ${NDRX_ULOG}/tmsrv-rm1.log -r -- -t60 -l/kvmpool/data/test/tmlogs/rm1 -n2 -X10 -h30 -a3</sysopt>
            <procgrp>RM1TMQ</procgrp>
        </server>
        <server name="tmqueue">
            <min>1</min>
            <max>1</max>
            <srvid>80</srvid>
            <cctag>RM1TMQ</cctag>
            <sysopt>-e ${NDRX_ULOG}/tmqueue-rm1.log -r -- -s1 -n2 -X60 -t60</sysopt>
            <procgrp>RM1TMQ</procgrp>

            <!-- Increase time for start wait, as there might be lots of messages
                 to load*
             -->
            <start_max>200</start_max>
            <!-- do not start next server within startup time -->
            <srvstartwait>200</srvstartwait>
        </server>
        <server name="tmrecoversv">
            <min>1</min>
            <max>1</max>
            <srvid>250</srvid>
            <procgrp>RM1TMQ</procgrp>
            <sysopt>-e ${NDRX_ULOG}/tmrecoversv-a.log -r -- -i</sysopt>
        </server>

        <!-- User-specific binaries: -->
        <server name="testsv.py">
            <min>3</min>
            <max>3</max>
            <srvid>1250</srvid>
            <sysopt>-e ${NDRX_ULOG}/testsv.py.log -r</sysopt>
            <procgrp>RM1TMQ</procgrp>
            <cctag>RM1TMQ</cctag>
        </server>
        <server name="banksv_a">
            <min>1</min>
            <max>1</max>
            <srvid>1500</srvid>
            <procgrp>GRP_A</procgrp>
            <sysopt>-e ${NDRX_ULOG}/banksv-a.log -r -- -s1</sysopt>
        </server>
        ... other RM1TMQ servers here ...
        <!--
            *** End of the group RM1TMQ ***
        -->
        <!--
            Establish link between nodes 1 & 2 (so transaction checks run faster)
        -->
        <server name="tpbridge">
            <max>1</max>
            <srvid>500</srvid>
            <sysopt>-e ${NDRX_ULOG}/tpbridge.log</sysopt>
            <!-- using -z5 / -c2 to enable broken connection detect after 10 sec -->
            <appopt>-f -n<other_node_id> -r -i <binding_or_host_ip> -p <binding_or_host_port> -t<A_for_client_B_for_server> -z5 -c2 -a10</appopt>
        </server>
        ...
        <server name="tmrecoversv">
            <min>1</min>
            <max>1</max>
            <srvid>4000</srvid>
            <sysopt>-e ${NDRX_ULOG}/tmrecoversv-periodic.log -r -- -p</sysopt>
        </server>
        <!--
            For demonstration purposes, client process will be also attached
            to the singleton group
        -->
        <server name="cpmsrv">
            <min>1</min>
            <max>1</max>
            <srvid>9999</srvid>
            <sysopt>-e ${NDRX_ULOG}/cpmsrv-dom1.log -r -- -k3 -i1</sysopt>
        </server>
    </servers>
    <clients>
        <!--  client processes linked to process group -->
        <client cmdline="restincl" procgrp="RM1TMQ">
            <exec tag="TAG1" subsect="SUBSECTION1" autostart="Y" log="${NDRX_ULOG}/restincl-a.log"/>
        </client>
    </clients>
</endurox>
Once groups are defined, Enduro/X instances can be started. Each group will be booted only on one of the nodes 1 or 2, but not on both at the same time. Processes that are not booted, are put in the "wait" state. For example, having node 1 start:
$ xadmin start -y
The test output from commands:
$ xadmin start -y
* Shared resources opened...
* Enduro/X back-end (ndrxd) is not running
* ndrxd PID (from PID file): 3494
* ndrxd idle instance started.
exec cconfsrv -k 0myWI5nu -i 1 -e /home/user1/test/log/cconfsrv.log -r --  :
        process id=3496 ... Started.
exec cconfsrv -k 0myWI5nu -i 2 -e /home/user1/test/log/cconfsrv.log -r --  :
        process id=3497 ... Started.
exec tpadmsv -k 0myWI5nu -i 10 -e /home/user1/test/log/tpadmsv.log -r --  :
        process id=3498 ... Started.
exec tpadmsv -k 0myWI5nu -i 11 -e /home/user1/test/log/tpadmsv.log -r --  :
        process id=3499 ... Started.
exec tpevsrv -k 0myWI5nu -i 20 -e /home/user1/test/log/tpevsrv.log -r --  :
        process id=3500 ... Started.
exec exsinglesv -k 0myWI5nu -i 30 -e /home/user1/test/log/exsinglesv-a.log -r --  :
        process id=3501 ... Started.
exec exsingleckl -k 0myWI5nu -i 40 -e /home/user1/test/log/exsingleckl-a.log -r --  :
        process id=3502 ... Started.
exec exsingleckl -k 0myWI5nu -i 41 -e /home/user1/test/log/exsingleckl-a.log -r --  :
        process id=3503 ... Started.
exec exsingleckl -k 0myWI5nu -i 42 -e /home/user1/test/log/exsingleckl-a.log -r --  :
        process id=3504 ... Started.
exec exsingleckl -k 0myWI5nu -i 43 -e /home/user1/test/log/exsingleckl-a.log -r --  :
        process id=3505 ... Started.
exec exsingleckl -k 0myWI5nu -i 44 -e /home/user1/test/log/exsingleckl-a.log -r --  :
        process id=3506 ... Started.
exec exsingleckr -k 0myWI5nu -i 50 -e /home/user1/test/log/exsingleckr-a.log -r --  :
        process id=3507 ... Started.
exec exsingleckr -k 0myWI5nu -i 51 -e /home/user1/test/log/exsingleckr-a.log -r --  :
        process id=3508 ... Started.
exec exsingleckr -k 0myWI5nu -i 52 -e /home/user1/test/log/exsingleckr-a.log -r --  :
        process id=3509 ... Started.
exec exsingleckr -k 0myWI5nu -i 53 -e /home/user1/test/log/exsingleckr-a.log -r --  :
        process id=3510 ... Started.
exec exsingleckr -k 0myWI5nu -i 54 -e /home/user1/test/log/exsingleckr-a.log -r --  :
        process id=3511 ... Started.
exec tmsrv -k 0myWI5nu -i 60 -e /home/user1/test/log/tmsrv-rm1.log -r -- -t1 -l/kvmpool/data/test/tmlogs/rm1 -X10 -n2 -h30 -a3 --  :
        process id=3512 ... Started.
exec tmsrv -k 0myWI5nu -i 61 -e /home/user1/test/log/tmsrv-rm1.log -r -- -t1 -l/kvmpool/data/test/tmlogs/rm1 -X10 -n2 -h30 -a3 --  :
        process id=3524 ... Started.
exec tmsrv -k 0myWI5nu -i 62 -e /home/user1/test/log/tmsrv-rm1.log -r -- -t1 -l/kvmpool/data/test/tmlogs/rm1 -X10 -n2 -h30 -a3 --  :
        process id=3536 ... Started.
exec tmqueue -k 0myWI5nu -i 80 -e /home/user1/test/log/tmqueue-rm1.log -r -- -s1 -n2 -X60 -t60 --  :
        process id=3548 ... Started.
exec tmrecoversv -k 0myWI5nu -i 250 -e /home/user1/test/log/tmrecoversv-a.log -r -- -i --  :
        process id=3711 ... Started.
exec testsv.py -k 0myWI5nu -i 1250 -e /home/user1/test/log/testsv.py.log -r --  :
        process id=3712 ... Started.
exec testsv.py -k 0myWI5nu -i 1251 -e /home/user1/test/log/testsv.py.log -r --  :
        process id=3713 ... Started.
exec testsv.py -k 0myWI5nu -i 1252 -e /home/user1/test/log/testsv.py.log -r --  :
        process id=3714 ... Started.
exec tpbridge -k 0myWI5nu -i 150 -e /home/user1/test/log/tpbridge_2.log -r -- -n2 -r -i x.x.x.x -p 21003 -tA -z30 :
        process id=3715 ... Started.
exec tmrecoversv -k 0myWI5nu -i 9900 -e /home/user1/test/log/tmrecoversv.log -- -p  --  :
        process id=3722 ... Started.
exec cpmsrv -k 0myWI5nu -i 9999 -e /home/user1/test/log/cpmsrv.log -r -- -k3 -i1 --  :
        process id=3723 ... Started.
Startup finished. 27 processes started.


$ xadmin pc
* Shared resources opened...
* ndrxd PID (from PID file): 3494
TAG1/SUBSECTION1 - running pid 3725 (process group RM1TMQ (no 5), Sun Oct  8 07:19:12 2023)
When node 2 is started, the following output is expected from the system (sample output):
$ xadmin start -y
* Shared resources opened...
* Enduro/X back-end (ndrxd) is not running
* ndrxd PID (from PID file): 31862
* ndrxd idle instance started.
exec cconfsrv -k 0myWI5nu -i 1 -e /home/user1/test/log/cconfsrv.log -r --  :
        process id=31864 ... Started.
exec cconfsrv -k 0myWI5nu -i 2 -e /home/user1/test/log/cconfsrv.log -r --  :
        process id=31865 ... Started.
exec tpadmsv -k 0myWI5nu -i 10 -e /home/user1/test/log/tpadmsv.log -r --  :
        process id=31866 ... Started.
exec tpadmsv -k 0myWI5nu -i 11 -e /home/user1/test/log/tpadmsv.log -r --  :
        process id=31867 ... Started.
exec tpevsrv -k 0myWI5nu -i 20 -e /home/user1/test/log/tpevsrv.log -r --  :
        process id=31868 ... Started.
exec exsinglesv -k 0myWI5nu -i 30 -e /home/user1/test/log/exsinglesv-a.log -r --  :
        process id=31869 ... Started.
exec exsingleckl -k 0myWI5nu -i 40 -e /home/user1/test/log/exsingleckl-a.log -r --  :
        process id=31870 ... Started.
exec exsingleckl -k 0myWI5nu -i 41 -e /home/user1/test/log/exsingleckl-a.log -r --  :
        process id=31871 ... Started.
exec exsingleckl -k 0myWI5nu -i 42 -e /home/user1/test/log/exsingleckl-a.log -r --  :
        process id=31872 ... Started.
exec exsingleckl -k 0myWI5nu -i 43 -e /home/user1/test/log/exsingleckl-a.log -r --  :
        process id=31873 ... Started.
exec exsingleckl -k 0myWI5nu -i 44 -e /home/user1/test/log/exsingleckl-a.log -r --  :
        process id=31874 ... Started.
exec exsingleckr -k 0myWI5nu -i 50 -e /home/user1/test/log/exsingleckr-a.log -r --  :
        process id=31875 ... Started.
exec exsingleckr -k 0myWI5nu -i 51 -e /home/user1/test/log/exsingleckr-a.log -r --  :
        process id=31876 ... Started.
exec exsingleckr -k 0myWI5nu -i 52 -e /home/user1/test/log/exsingleckr-a.log -r --  :
        process id=31877 ... Started.
exec exsingleckr -k 0myWI5nu -i 53 -e /home/user1/test/log/exsingleckr-a.log -r --  :
        process id=31878 ... Started.
exec exsingleckr -k 0myWI5nu -i 54 -e /home/user1/test/log/exsingleckr-a.log -r --  :
        process id=31879 ... Started.
exec tmsrv -k 0myWI5nu -i 60 -e /home/user1/test/log/tmsrv-rm1.log -r -- -t1 -l/kvmpool/data/test/tmlogs/rm1 -n2 -X10 -h30 -a3 --  :
        process id=0 ... Waiting on group lock.
exec tmsrv -k 0myWI5nu -i 61 -e /home/user1/test/log/tmsrv-rm1.log -r -- -t1 -l/kvmpool/data/test/tmlogs/rm1 -n2 -X10 -h30 -a3 --  :
        process id=0 ... Waiting on group lock.
exec tmsrv -k 0myWI5nu -i 62 -e /home/user1/test/log/tmsrv-rm1.log -r -- -t1 -l/kvmpool/data/test/tmlogs/rm1 -n2 -X10 -h30 -a3 --  :
        process id=0 ... Waiting on group lock.
exec tmqueue -k 0myWI5nu -i 80 -e /home/user1/test/log/tmqueue-rm1.log -r -- -s1 -n2 -X60 -t60 --  :
        process id=0 ... Waiting on group lock.
exec testsv.py -k 0myWI5nu -i 1250 -e /home/user1/test/log/testsv.py.log -r --  :
        process id=0 ... Waiting on group lock.
exec testsv.py -k 0myWI5nu -i 1251 -e /home/user1/test/log/testsv.py.log -r --  :
        process id=0 ... Waiting on group lock.
exec testsv.py -k 0myWI5nu -i 1252 -e /home/user1/test/log/testsv.py.log -r --  :
        process id=0 ... Waiting on group lock.
exec tmrecoversv -k 0myWI5nu -i 250 -e /home/user1/test/log/tmrecoversv-a.log -r -- -i --  :
        process id=0 ... Waiting on group lock.
exec tpbridge -k 0myWI5nu -i 150 -e /home/user1/test/log/tpbridge_2.log -r -- -n1 -r -i 0.0.0.0 -p 21003 -tP -z30 :
        process id=31880 ... Started.
exec tmrecoversv -k 0myWI5nu -i 9900 -e /home/user1/test/log/tmrecoversv.log -- -p  --  :
        process id=31887 ... Started.
exec cpmsrv -k 0myWI5nu -i 9999 -e /home/user1/test/log/cpmsrv.log -r -- -k3 -i1 --  :
        process id=31888 ... Started.
Startup finished. 19 processes started.

$ xadmin pc
* Shared resources opened...
* ndrxd PID (from PID file): 31862
TAG1/SUBSECTION1 - waiting on group lock (process group RM1TMQ (no 5), Sun Oct  8 14:19:49 2023)
Group was locked on node 1 and on node 2 processes in group RM1TMQ are put in the wait state (waiting on lock).
After the startup XATMI server process states can be inspected by the following command:
$ xadmin ppm
Example from 2nd node:
$ xadmin ppm
BINARY   SRVID      PID    SVPID STATE REQST AS EXSQ RSP  NTRM LSIG K STCH FLAGS
-------- ----- -------- -------- ----- ----- -- ---- ---- ---- ---- - ---- -----
cconfsrv     1     5711     5711 runok runok  1    0   61    0   61 1   61
cconfsrv     2     5712     5712 runok runok  1    0   61    0   61 1   61
tpadmsv     10     5713     5713 runok runok  1    0   61    0   61 1   61
tpadmsv     11     5714     5714 runok runok  1    0   61    0   61 1   61
tpevsrv     20     5715     5715 runok runok  1    0   61    0   61 1   61
exsingle    30     5716     5716 runok runok  1    0   61    0   61 1   61 L
exsingle    40     5717     5717 runok runok  1    0   61    0   61 1   61
exsingle    41     5718     5718 runok runok  1    0   61    0   61 1   61
exsingle    42     5719     5719 runok runok  1    0   61    0   61 1   61
exsingle    43     5720     5720 runok runok  1    0   61    0   61 1   61
exsingle    44     5721     5721 runok runok  1    0   61    0   61 1   61
exsingle    50     5722     5722 runok runok  1    0   61    0   61 1   61
exsingle    51     5723     5723 runok runok  1    0   61    0   61 1   61
exsingle    52     5724     5724 runok runok  1    0   61    0   61 1   61
exsingle    53     5725     5725 runok runok  1    0   61    0   61 1   61
exsingle    54     5726     5726 runok runok  1    0   61    0   61 1   61
tmsrv       60        0        0 wait  runok  1    0   61    0   61 1   61
tmsrv       61        0        0 wait  runok  1    0   61    0   61 1   61
tmsrv       62        0        0 wait  runok  1    0   61    0   61 1   61
tmqueue     80        0        0 wait  runok  1    0   61    0   61 1   61
testsv.p  1250        0        0 wait  runok  1    0   61    0   61 1   61
testsv.p  1251        0        0 wait  runok  1    0   61    0   61 1   61
testsv.p  1252        0        0 wait  runok  1    0   61    0   61 1   61
tmrecove   250        0        0 wait  runok  1    0   61    0   61 1   61
tpbridge   150     5727     5727 runok runok  1    0   61    0   61 1   61 BrC
tmrecove  9900     5734     5734 runok runok  1    0   61    0   61 1   61
cpmsrv    9999     5735     5735 runok runok  1    0   61    0   61 1   61
With the following command lock groups can be inspected for the current application running:
$ xadmin ppm -3
Example from the second node:
$ xadmin ppm -3
BINARY   SRVID      PID    SVPID PROCGRP   PGNO PROCGRPL PGLNO PGNLA
-------- ----- -------- -------- -------- ----- -------- ----- -----
cconfsrv     1     5711     5711 -            0 -            0     0
cconfsrv     2     5712     5712 -            0 -            0     0
tpadmsv     10     5713     5713 -            0 -            0     0
tpadmsv     11     5714     5714 -            0 -            0     0
tpevsrv     20     5715     5715 -            0 -            0     0
exsingle    30     5716     5716 -            0 RM1TMQ       5     5
exsingle    40     5717     5717 -            0 RM1TMQ       5     0
exsingle    41     5718     5718 -            0 RM1TMQ       5     0
exsingle    42     5719     5719 -            0 RM1TMQ       5     0
exsingle    43     5720     5720 -            0 RM1TMQ       5     0
exsingle    44     5721     5721 -            0 RM1TMQ       5     0
exsingle    50     5722     5722 -            0 RM1TMQ       5     0
exsingle    51     5723     5723 -            0 RM1TMQ       5     0
exsingle    52     5724     5724 -            0 RM1TMQ       5     0
exsingle    53     5725     5725 -            0 RM1TMQ       5     0
exsingle    54     5726     5726 -            0 RM1TMQ       5     0
tmsrv       60        0        0 RM1TMQ       5 -            0     0
tmsrv       61        0        0 RM1TMQ       5 -            0     0
tmsrv       62        0        0 RM1TMQ       5 -            0     0
tmqueue     80        0        0 RM1TMQ       5 -            0     0
testsv.p  1250        0        0 RM1TMQ       5 -            0     0
testsv.p  1251        0        0 RM1TMQ       5 -            0     0
testsv.p  1252        0        0 RM1TMQ       5 -            0     0
tmrecove   250        0        0 RM1TMQ       5 -            0     0
tpbridge   150     5727     5727 -            0 -            0     0
tmrecove  9900     5734     5734 -            0 -            0     0
cpmsrv    9999     5735     5735 -            0 -            0     0
Where columns explained:
- PROCGRP - Process group name set in <procgrp> for the server.
- PGNO - Process group number.
- PROCGRPL - This process is lock provider for a given group (group name).
- PGLNO - This process is lock provider for a given group (group number).
- PGNLA - This is the reported group number for which the lock provider is serving.
Additionally, the following useful commands are available in Enduro/X for support of process/singleton groups.
Processes in process groups (including singleton process groups), additionally can be controlled by following commands:
XATMI servers:
- $ xadmin start -g <group name>
- $ xadmin stop -g <group name>
- $ xadmin sreload -g <group name>
- $ xadmin restart -g <group name>
Client processes:
- $ xadmin bc -g <group name>
- $ xadmin sc -g <group name>
- $ xadmin rc -g <group name>
To avoid initiation of the failover (the good node takes the bad node’s lock and boots the group), Enduro/X has the following commands:
- xadmin mmon
- xadmin mmoff
mmon command enables maintenance mode for a given node where the command is executed. After enabling such a command, the node will not take new locks / perform fail-over. This might be useful if the planned shutdown of the currently active node shall be done, and failover to other working nodes is not required.
mmoff command puts the node back to normal.
the current state of the maintenance mode can be checked by:
- $ xadmin shmcfg
For example
$ xadmin shmcfg

shmcfgver_lcf = 0
use_ddr = 0
ddr_page = 0
ddr_ver1 = 0
is_mmon = 1
indicates that mode is enabled (is_mmon is 1). The setting is stored in shared memory and can be enabled before the given node startup.
At full Enduro/X shutdown, if it was set, the node is set back to 0.
To check singleton group statuses on the given machine, the following command may be used:
- xadmin psg
Example:
$ xadmin psg

SGID LCKD MMON SBOOT CBOOT LPSRVID    LPPID LPPROCNM          REFRESH RSN FLAGS
---- ---- ---- ----- ----- ------- -------- ---------------- -------- --- -----
   5 Y    N    Y     Y          10 24642038 exsinglesv             1s   0 iv
Where columns explained:
SGID - Singleton Process Group id/number. Set in <endurox>/<procgroups>/<procgroup> attribute grpno.
LCKD - Is group locked locally. Y - locked, N - not.
MMON - RFU, always N.
SBOOT - Is server boot completed. Y - yes, N - no.
CBOOT - Is client (in <clients> section) boot completed Y - yes, N - no.
LPSRVID - srvid of the lock provider server.
LPPID - Lock provider pid.
LPPROCNM - Lock provider process name.
REFRESH - Time from last lock provider refresh (i.e. is locked, and verification passed of the locks).
RNS - Reason for lock loss. May take following values: 1 - Expired by missing refresh, 2 - PID missing of lock holder, 5 - Normal shutdown. 6 - Locking error (by exsinglesv), 7 - Corrupted structures. 8 - Locked by network response (other node has got the lock), 9 - Network sequence ahead of us (>=). 10 Their - (other node seq) in heartbeat file (lockfile_2) (>=) our lck seq.
FLAGS - n - no order boot enabled (i.e. noorder set to Y for group), i - singleton group configured (in-use), v - group verification enabled (i.e. group sg_nodes_verify setting set to Y).
Enduro/X in several places uses standard configuration string format. This configuration string may encode key=value data, as well only key (keywords) may appear in the string. The separator between keywords/keyword+value pairs is any of <space>, <tab>, <comma> which may be combined. The value may be quoted string with single or double quotes. The value may contain the quotes which shall be escaped with a backslash, in case if using other quotes, then for value opening the escape is not needed. The backslash can be escaped too.
Examples:
# key/value based:

- somekey1='value1, "other value"', somekey2=some_value somekey3="some value \" \\3"

which will have:

- [somekey1] with value [value1, "other value"]
- [somekey2] with value [some_value]
- [somekey3] with value [some value " \3]

# key based:

- keyword1, keyword2,,,, keyword3       keyword4

which will have:

- [keyword1]
- [keyword2]
- [keyword3]
- [keyword4]
This format is not used in all places in Enduro/X, but where the use is made, the documentation refers to this as "standard configuration string".
This section lists common issues and their resolutions for runtime operations.
Error EDB_READERS_FULL may appear, if processes using LMDB data access (as part of UBFDB or Enduro/X Smart Cache), reaches readers limit (which is default is 1000). If more than this number of processes accesses the LMDB database, the error EDB_READERS_FULL is generated.
To solve this issue, parameter max_readers must be adjusted in Enduro/X ini files.
In case if error is related to UBF DB (dynamic UBF field table):
[@ubfdb[/CCTAG]]
...
# Increase the MAX_READERS, for example 5000
max_readers=5000
resource=DATABASE_DIRECTORY
...
In case if error is related to Enduro/X Smart Cache:
[@cachedb/DBNAME_SECTION]

# Increase the MAX_READERS, for example 5000
max_readers=5000
resource=DATABASE_DIRECTORY
The target number of max_readers depends on number of processes actually using that resource, so some estimation must be made, to set the value correctly.
To activate the parameter:
- Update the configuration (as previously written).
- Stop Enduro/X application.
- Contents of the resource directory DATABASE_DIRECTORY (path pointed by resource) shall be removed.
- Start Enduro/X application. New readers count shall be effective.
This section lists additional related documents.
Related documents
[EX_OVERVIEW] ex_overview(guides)
[EX_ENV] ex_env(5)
[NDRXCONFIG] ndrxconfig.xml(5)
[DEBUGCONF] ndrxdebug.conf(5)
[XADMIN] xadmin(8)
[TPBRIDGE] tpbridge(8)